16 Candlestick Patterns You Must Know and How to Read Them
Technical analysis proposes various trading indicators and tools to help determine price trends and anticipate reversals. Besides technical indicators, another great method to analyzing price action is to read the candlestick chart and its patterns.
As you may know, there are several ways to display the historical price of an asset, be it a forex pair, company share or cryptocurrency. The three most popular chart types are the line chart, bar chart and candlestick chart. Most traders prefer using the candlestick chart, since it can provide a variety of patterns that can predict trend reversals or continuations with a certain degree of accuracy.
A candlestick pattern is a movement in an asset’s price shown graphically on a candlestick chart and used to review or anticipate a specific market behavior. Over time, traders observed that price actions had moved in similar ways when specific patterns preceded them on the candlestick chart. So they isolated these patterns, organizing them into different categories to be used as technical analysis tools. But what’s a candlestick all about?
What is a Candlestick Chart?
A candlestick chart is a method of displaying the historical price movement of an asset over time. Each candlestick represents a certain period, depending on the time frame selected by the trader. For example, if you set the 1D chart, each candlestick stands for one day.
Researchers agree that a Japanese rice trader was the first to conceptualize the candlestick, and the abstraction of candlesticks subsequently reached greater use in the Western world with Steve Nison’s 1991 book entitled Japanese Candlestick Charting Techniques.
Here are several vital components that make price analysis intuitive to comprehending the candlestick’s purpose.
Candle Body
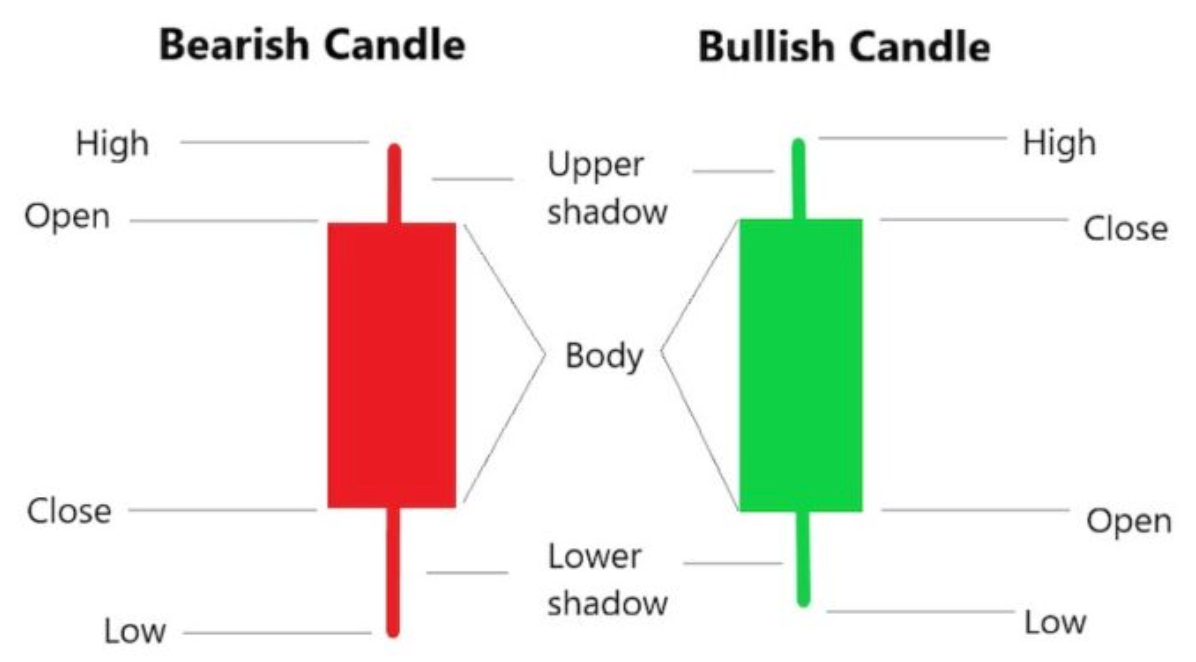
The candle body represents the open and close price of an asset. The open or close points’ position depends on whether the candlestick, and hence the price, is bullish or bearish in a given period. In a bullish market, the close will be above the open, and vice versa for a bearish market.
Candle Wick/Shadow
Each candlestick generally has two so-called shadows, or wicks, though this is not generally a rule. The shadows represent the high and low of a price for a given period. Thus, the upper shadow stands for the peak, and the lower shadow shows the lowest point touched by the price. Sometimes only one shadow might be visible, which happens when the other shadow coincides with the open or close and is on the same horizontal line as that of the body.
Candle Color
The color of the body shows the direction of price movement. Usually, a green (or white) body suggests a price increase, while a red (or black) body points to a price decline. You’ll likely see green and red bodies on most platforms. Consequently, if the body is green, its upper limit will indicate the close price.
How Do Candlesticks Work in Trading?
The candlestick chart is by far the most comprehensive graphic style for displaying the price of an asset. Cryptocurrency traders borrowed this type of chart from stock and forex trading. Unlike the line chart, which shows only the close price, the candlestick chart provides a lot of information about the historical price thanks to its structure (discussed above).
Candlesticks form chronologically one after another, and may help you see the general trend as well as resistance and support lines, even without technical indicators. In addition, they can display certain patterns that act as buy or sell signals. The use of the candlestick chart is especially relevant to cryptocurrencies, which are highly volatile and require detailed technical analysis.
Top 16 Candlestick Patterns You Must Know
While there are plenty of candlestick patterns, we’ll list the most popular and reliable ones, starting with bullish patterns, which show up after a downtrend and anticipate an upward reversal. Cryptocurrency traders usually open long positions when these patterns appear.
1. Hammer
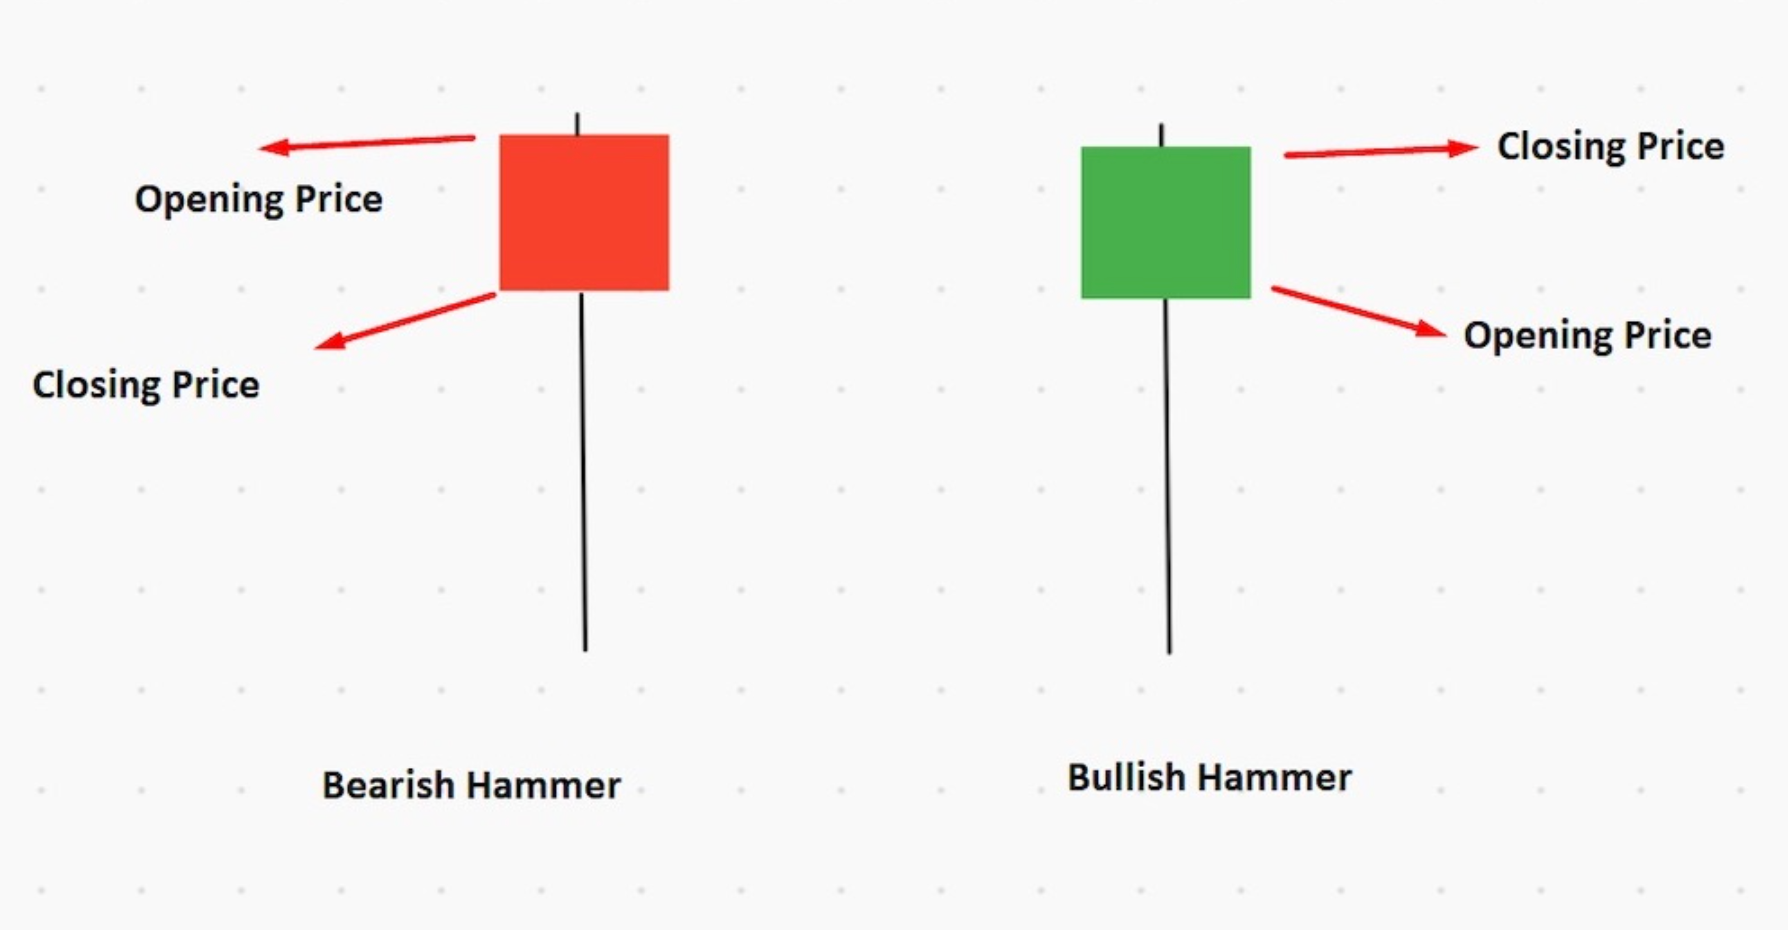
The hammer candlestick consists of a short body with a much longer lower shadow. It’s called a hammer pattern because the candlestick resembles the shape of an upright hammer. As a rule, you’ll find the hammer at the bottom of a downtrend. This pattern indicates that bulls have resisted the selling pressure during a given period, and have pushed the price back up. While there may be hammer patterns with either green or red candles, the former points to a stronger uptrend than red hammers.
2. Inverted Hammer
The inverted hammer is similar to the standard hammer pattern, but it has a much longer upper shadow, while the lower wick is very short. This pattern suggests buying pressure, followed by bears’ failed attempts to drag the price down. As a result, buyers come back with even stronger pression, pushing prices higher.
3. Bullish Engulfing
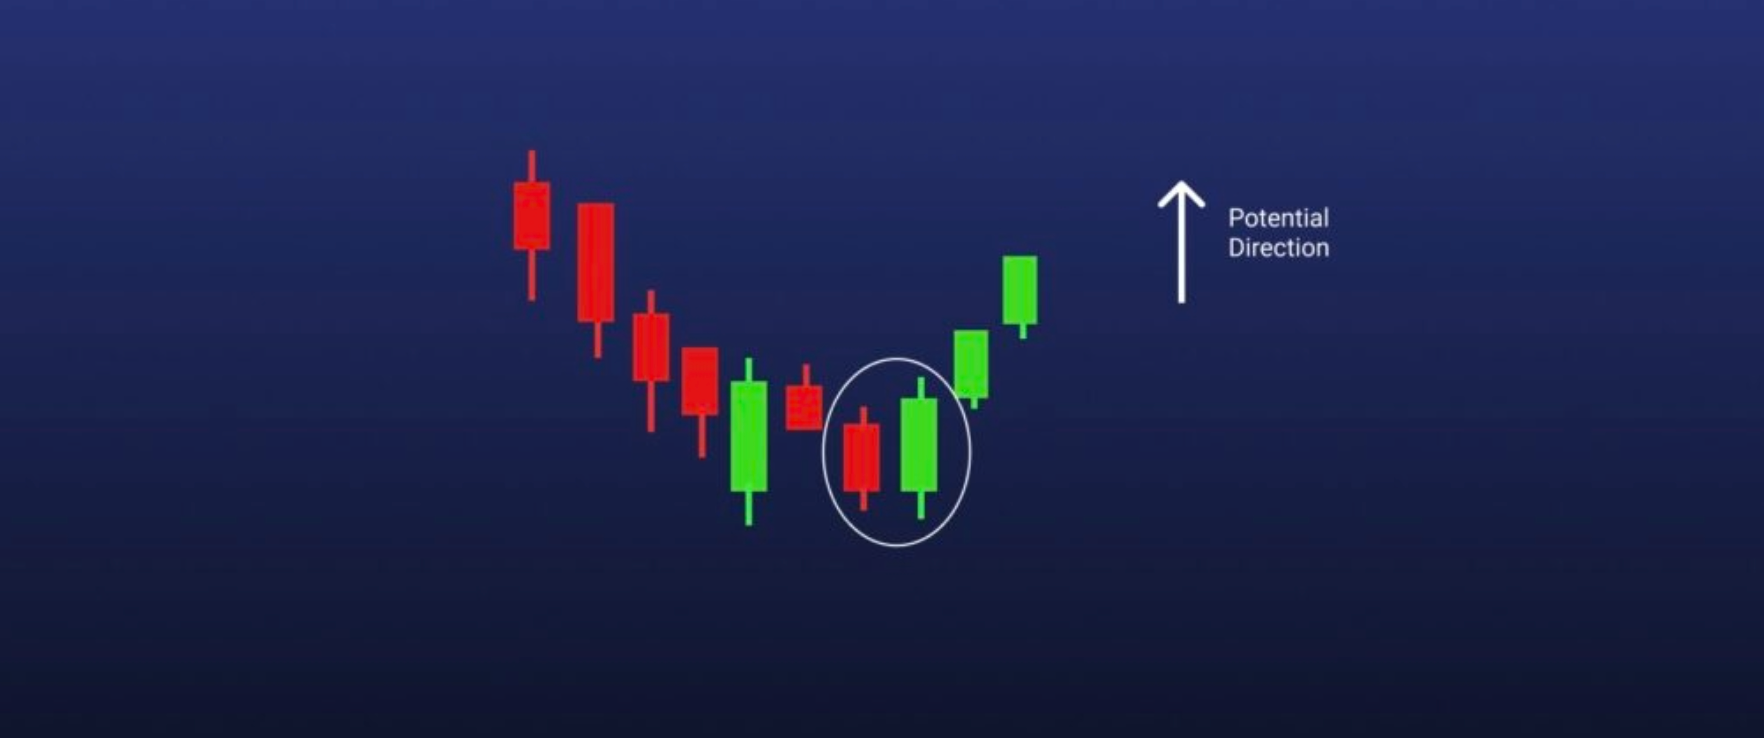
Unlike the previous two patterns, the bullish engulfing is made up of two candlesticks. The first candle should be a short red body, engulfed by a green candle, which has a larger body. While the second candle opens lower than the previous red one, the buying pressure increases, leading to a reversal of the downtrend.
4. Piercing Line
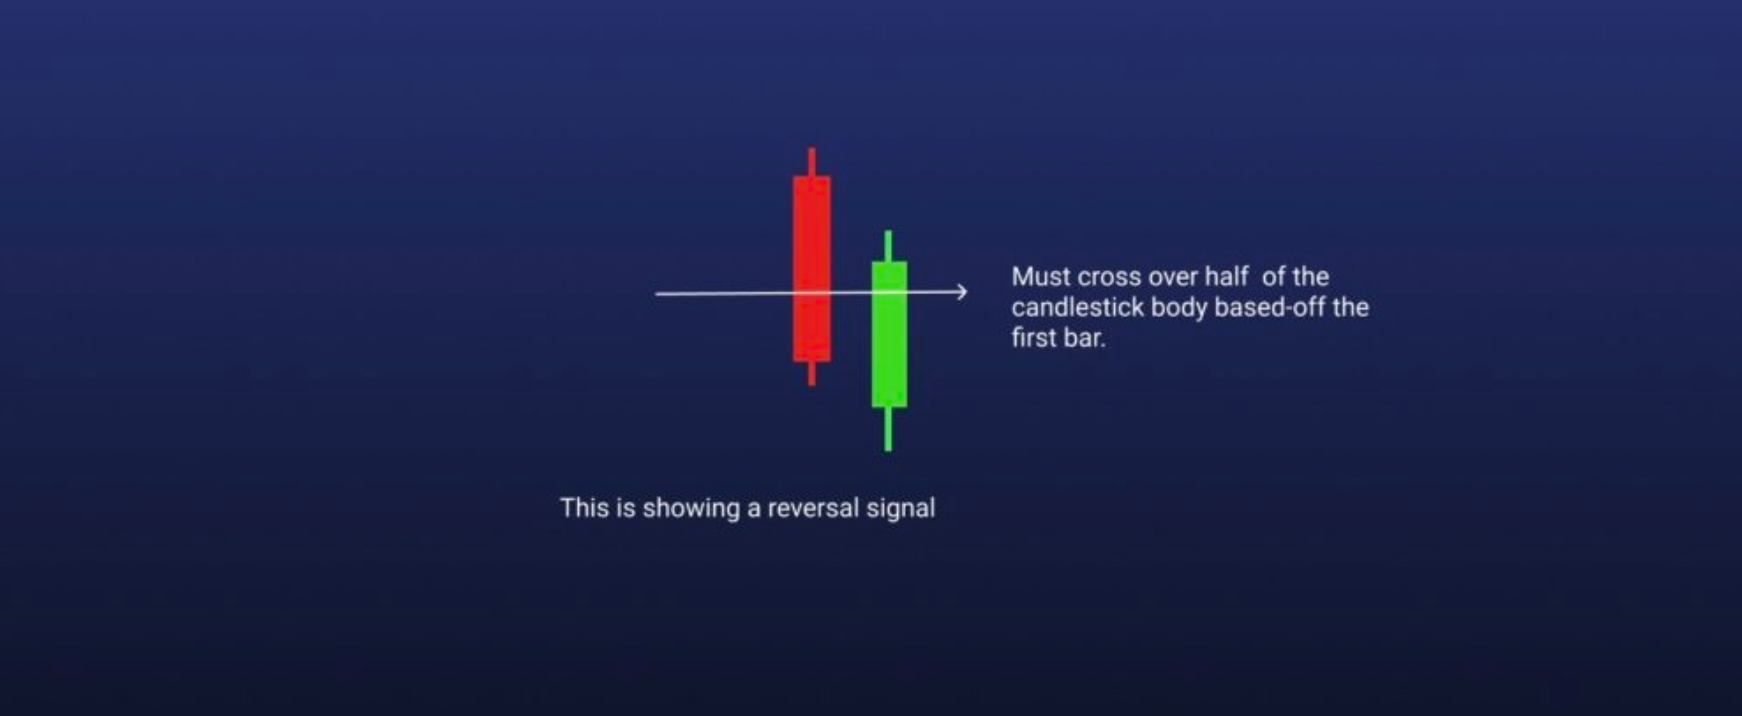
Another two-candlestick pattern is the piercing line, which may show up at the bottom of a downtrend at the support level, or during a pullback with the anticipation of a bullish movement. The pattern consists of a long red candle that’s followed by a long green candle. The critical aspect of this pattern is that there’s a significant gap between the red candle’s closing price and the green candle’s open price. The close should also cover at least half of the length of the previous day’s red candlestick body. The fact that the green candle closes much higher than the open points to buying pressure.
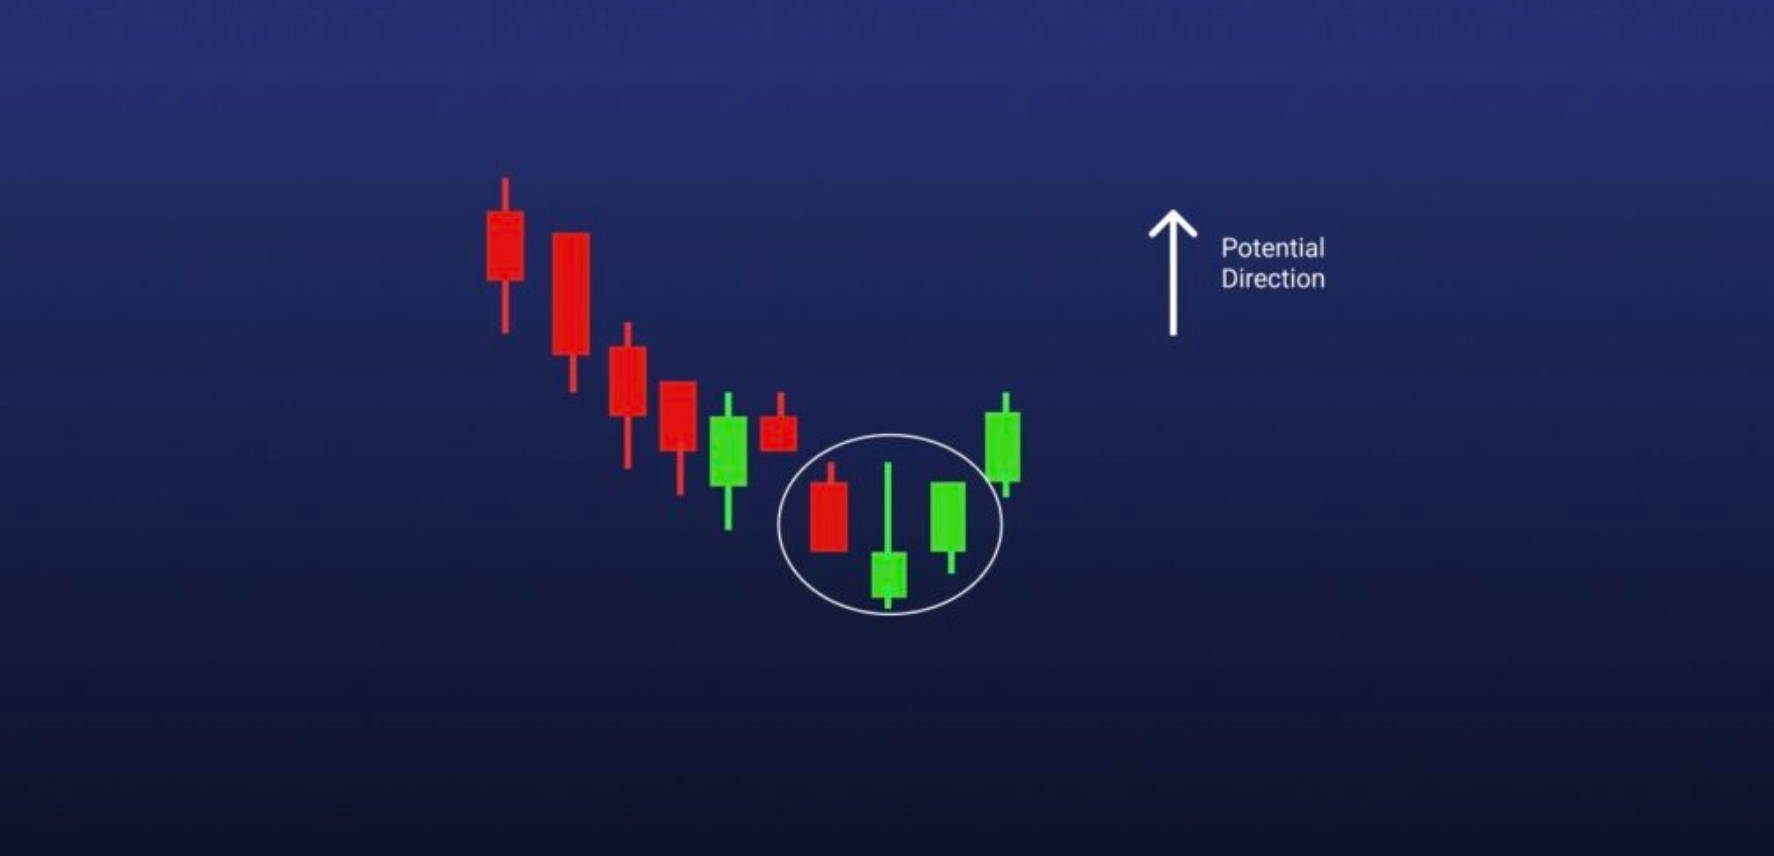
5. Morning Star
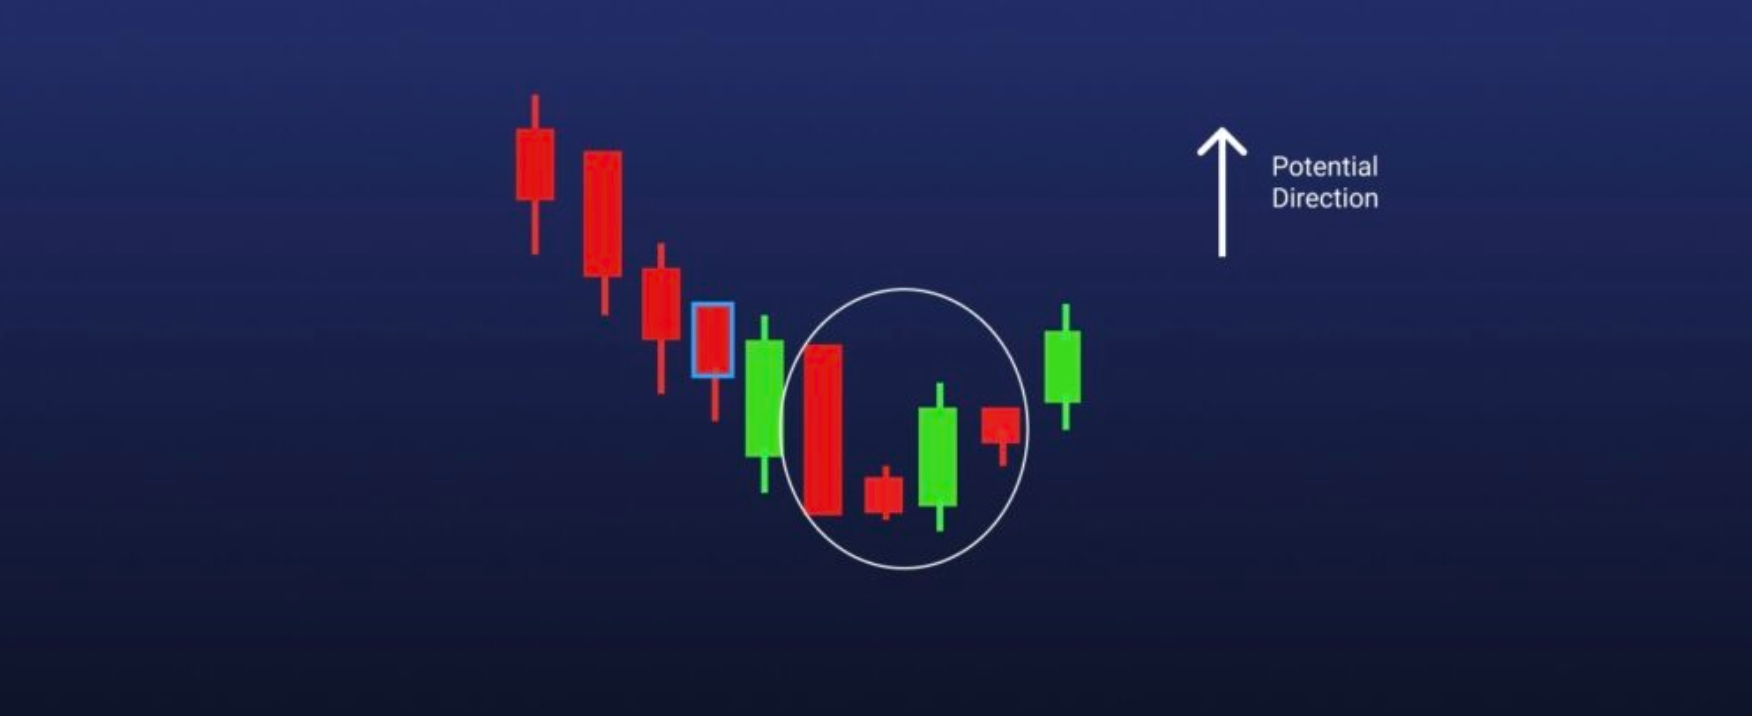
The morning star pattern is more complex because it comprises three candlesticks: a long red candle, followed by a short-bodied candle and a long green one. The morning star pattern suggests that the first period’s selling pressure is fading, and a bull market is forming.
6. Three White Soldiers
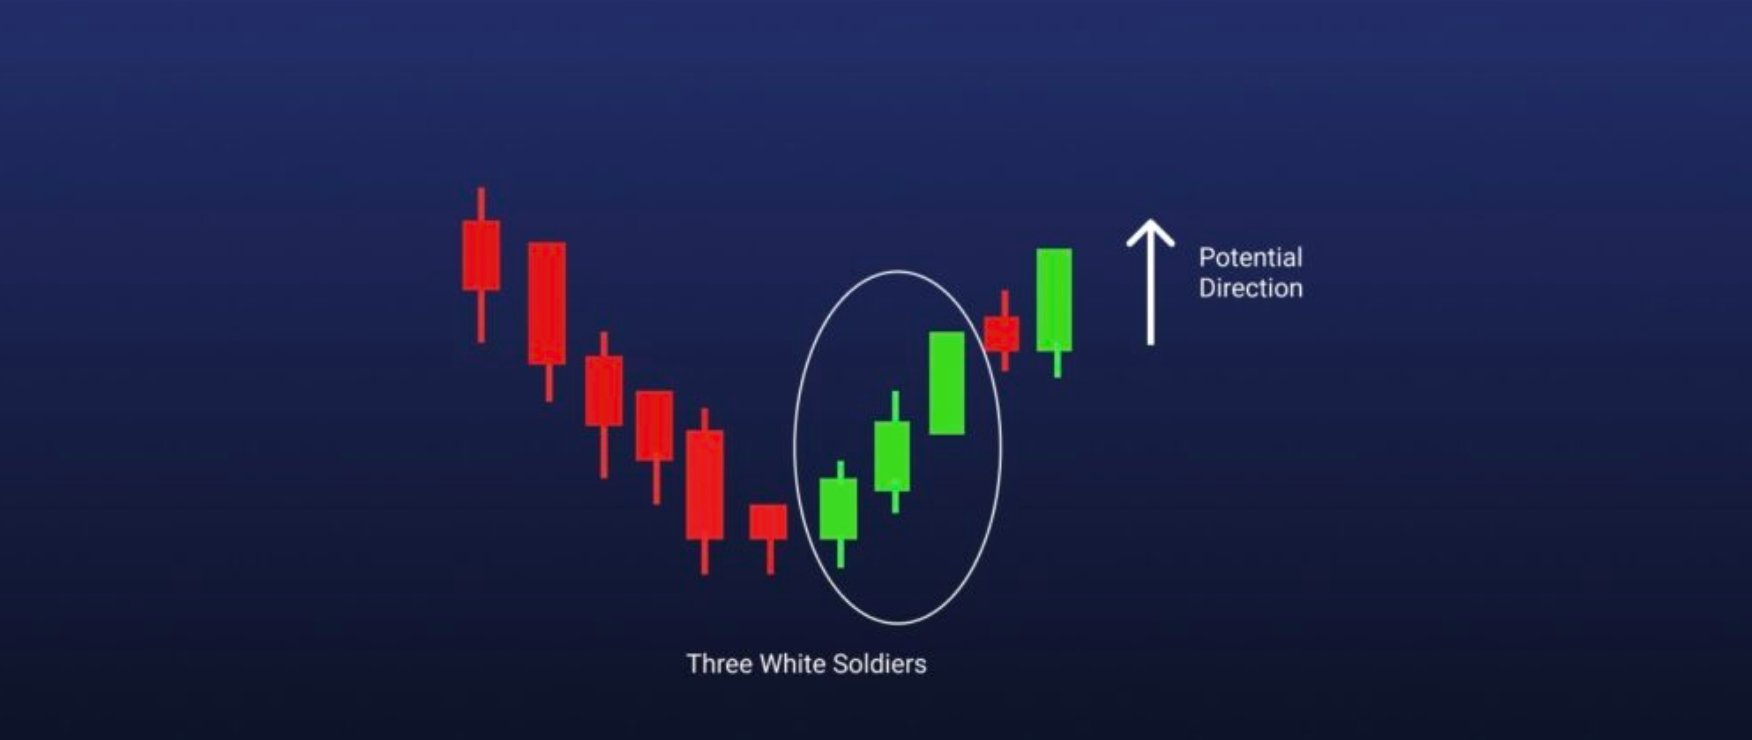
Another three-stick candle is the three white soldiers. It’s made up of three long green candles in a row, generally with very short shadows. The primary condition is that the three consecutive greens have to open and close higher than the previous period. This pattern is regarded as a strong bullish signal that shows up after a downtrend.
Next, we’ll discuss a batch of bearish patterns that anticipate an uptrend reversal and usually come at resistance zones. These patterns generally prompt traders to either close their longs or open short positions.
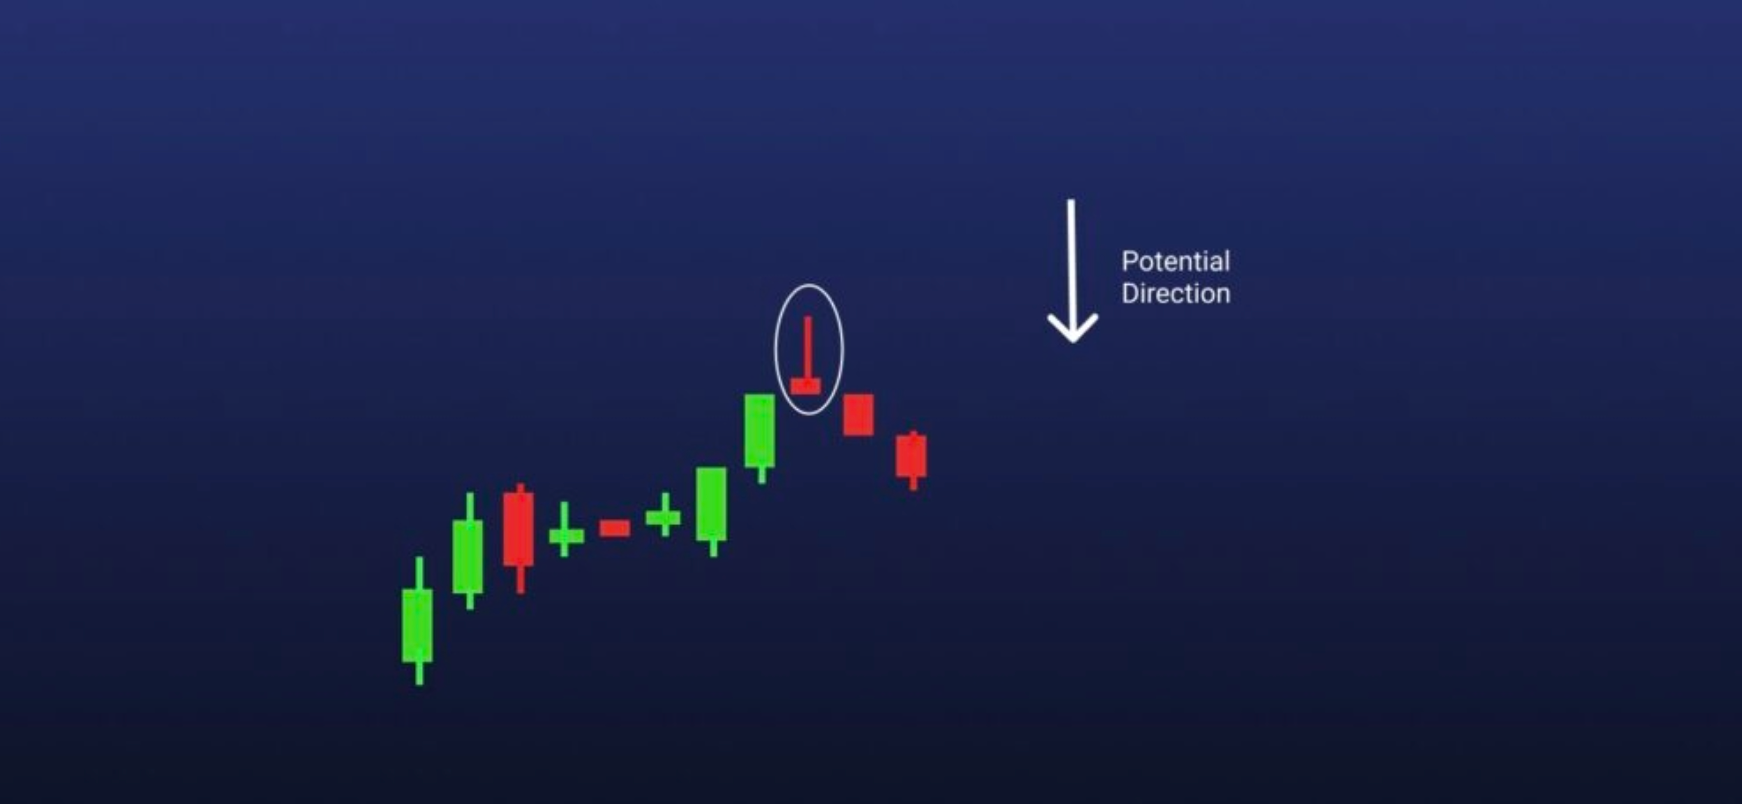
7. Hanging Man
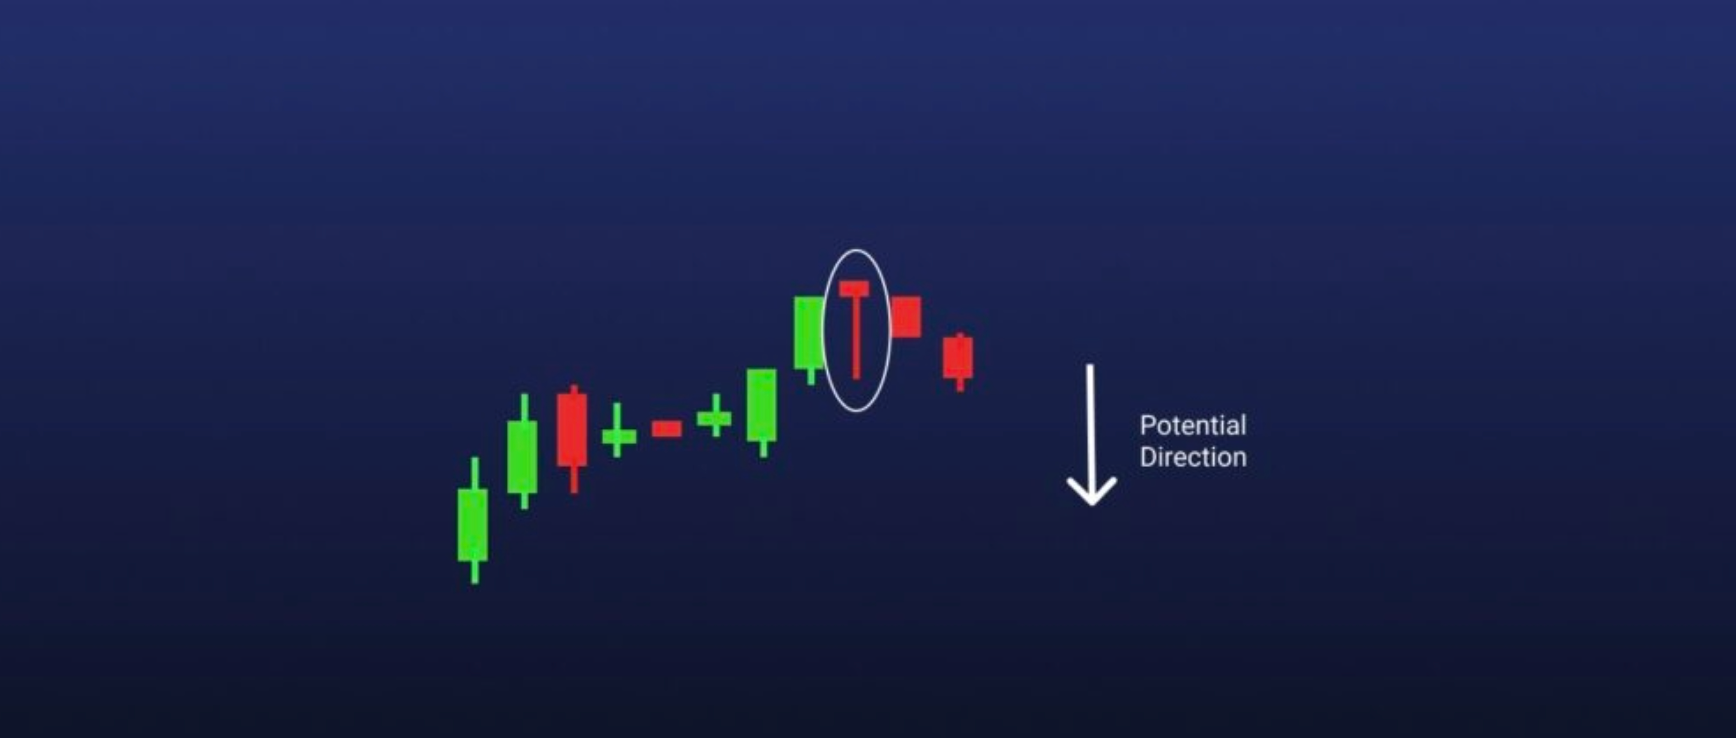
The hanging man is formed by a green or red candlestick with a short body and a long lower shadow. It typically appears at the end of an uptrend and suggests a considerable sell-off is coming, but bulls could temporarily push prices higher, after which they’ll lose control.
8. Shooting Star
The shooting star is the opposite of an inverted hammer. It consists of a red candle with a short body and a long upper shadow. Generally, the market will gap a bit higher on the candlestick opening and will surge to a local peak before closing just below the open. The body can sometimes be almost nonexistent.
9. Bearish Engulfing
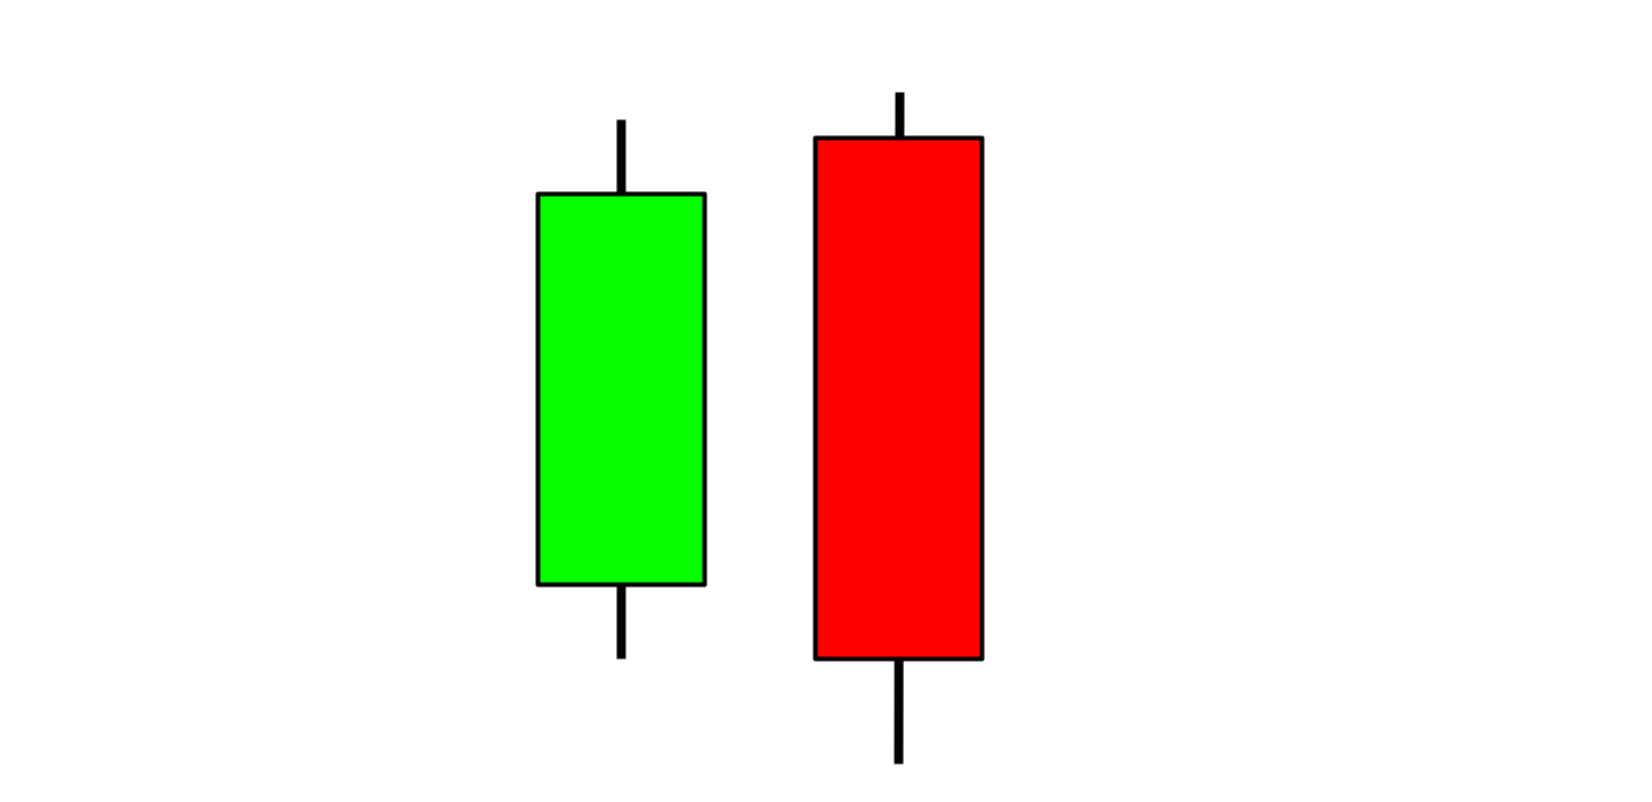
The bearish engulfing pattern is the inverted version of a bullish engulfing, so the first candle has a small green body and is completely covered by the next long red candle. This pattern comes at the peak of an uptrend and suggests a reversal. The lower the second candle continues, the more momentum the bearish move will have.
10. Evening Star
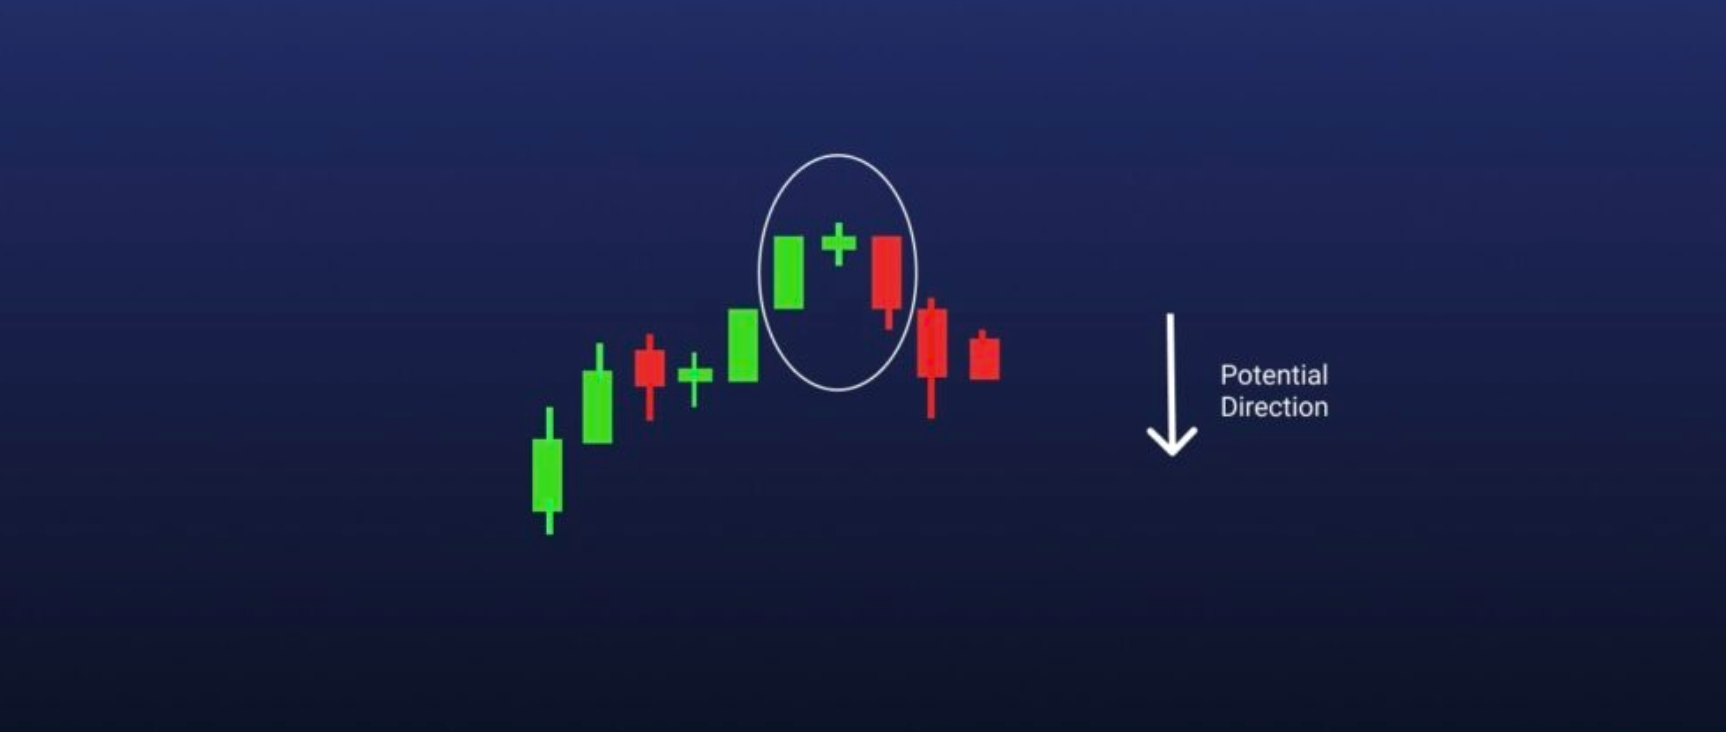
The evening star represents a specific three-stick pattern. It consists of a short-bodied candle that comes between a long green candle and a large red candle that closes below the midpoint of the first green candle. This pattern usually appears at the top of an uptrend and signals a potential reversal.
11. Three Black Crows
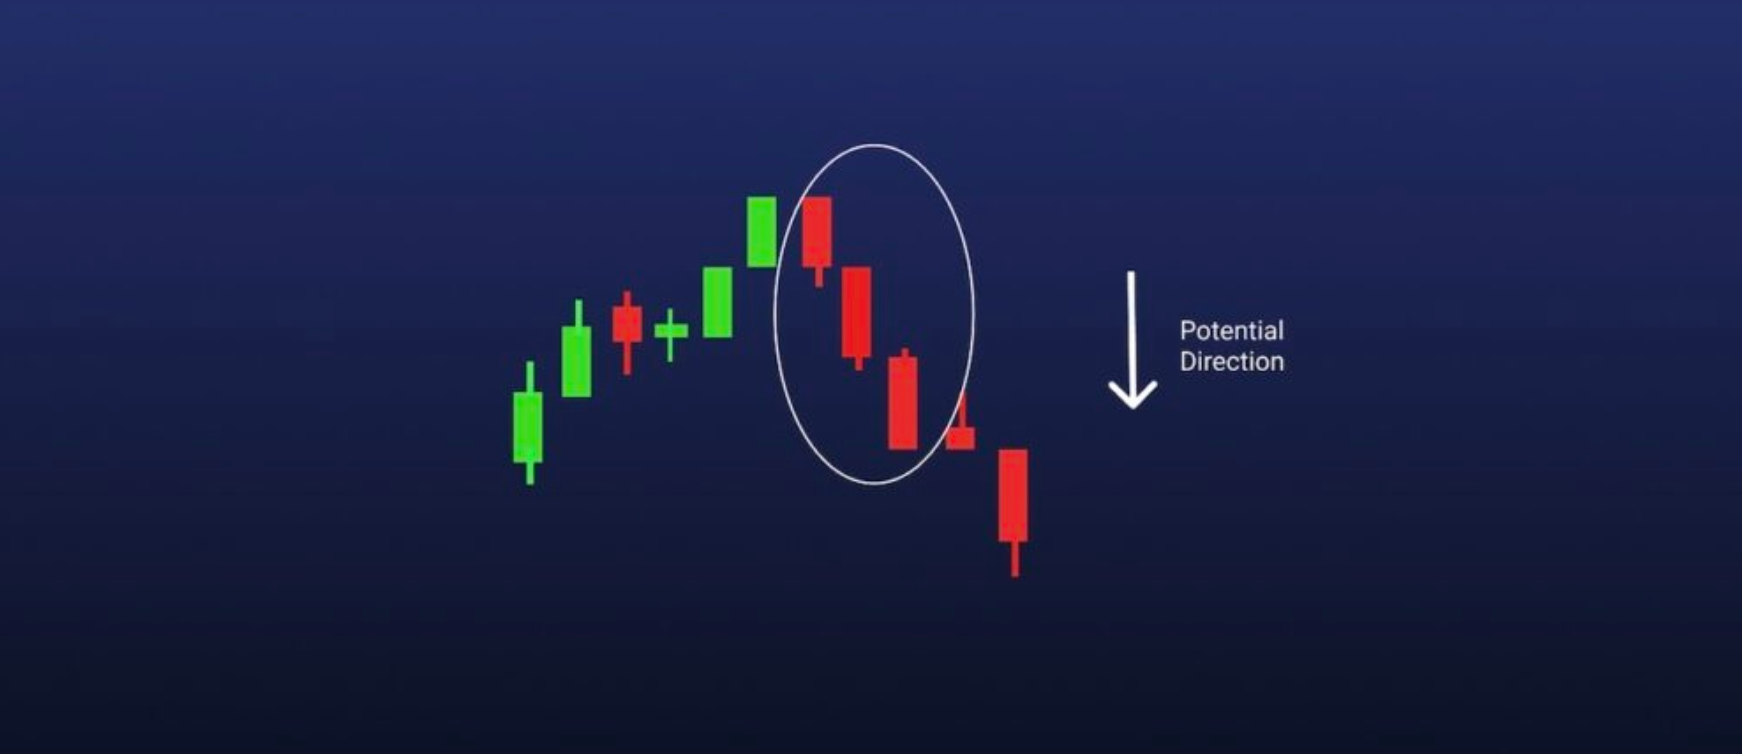
The three black crows pattern comprises three long straight reds with short or almost nonexistent shadows. Every new candle opens at relatively the same price as the previous one, but goes much lower with every close. It’s regarded as a strong bearish signal.
12. Dark Cloud Cover
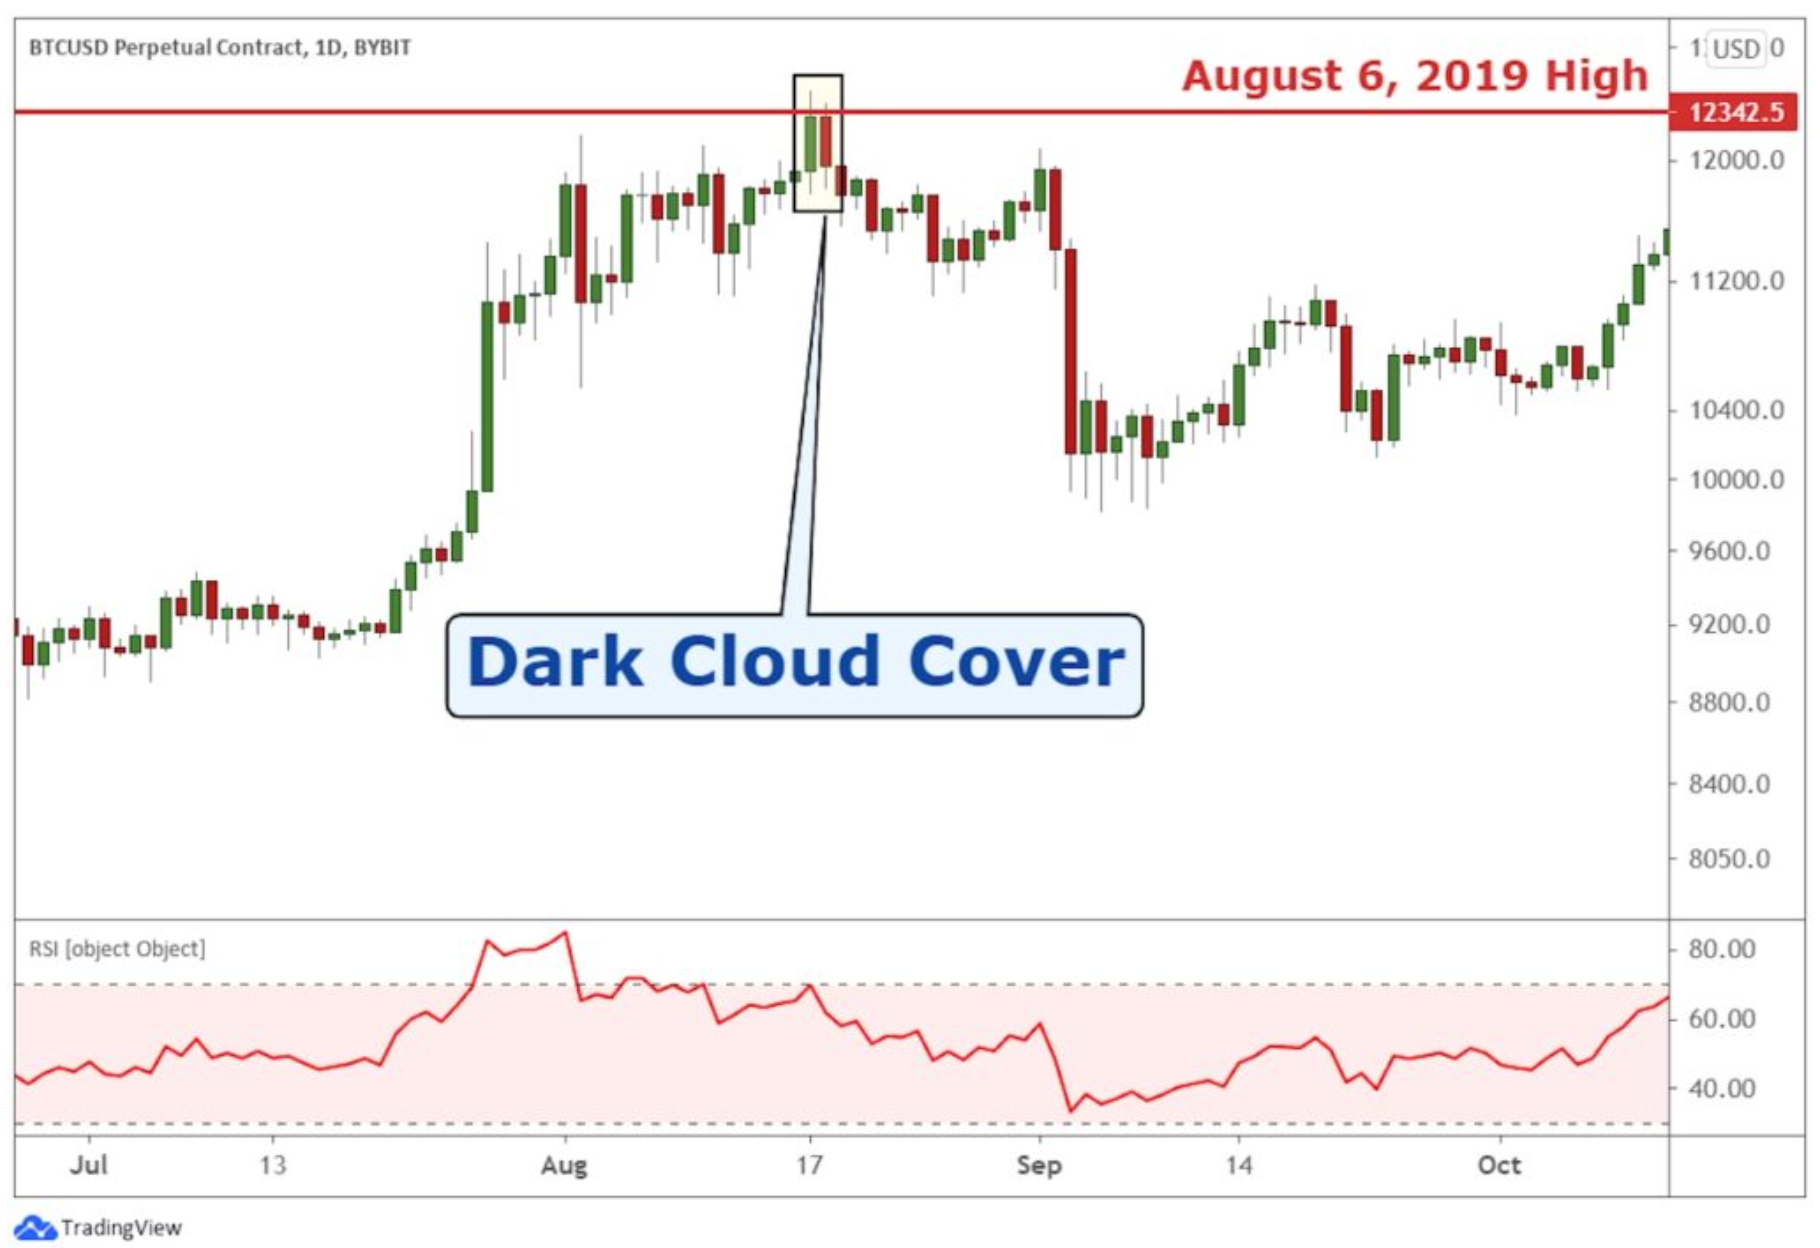
The dark cloud cover pattern is like the piercing line, but is its inverse. It anticipates a bearish reversal, and comprises two candlesticks — a red candle that opens above the previous green body and closes below its midpoint. This pattern suggests that bears have taken control of the market, pushing prices lower. If the shadows of the candles are short, then traders can expect a strong downtrend.
Besides the bullish and bearish patterns that anticipate trend reversals, there are also candlestick patterns that are either neutral or point to the continuation of a trend, be it bullish or bearish.
They include the following:
- Doji
- Spinning Top
- Falling Three Methods
- Rising Three Methods
13. Doji

The doji candlestick has an exceptionally small body and a long shadow. While it’s generally perceived as a trend continuation pattern, traders should be careful because it might also signal a reversal. To avoid confusion, open a position a few candles after a doji when the situation becomes clear.
14. Spinning Top

Like doji, the spinning top is a candlestick with a short body. However, the two shadows are of equivalent length with the body in the middle. This pattern also indicates indecision, and may suggest a period of rest or consolidation after a significant rally or price decline.
15. Falling Three Methods

Falling three methods is a pattern consisting of five candles in a specific arrangement, indicating the continuation of a downtrend. It comprises a long red body, followed by three small consecutive green bodies and another long red body. The green candles’ bodies are all covered by the bearish reds, demonstrating that bulls don’t have enough power to reverse the downtrend.
16. Rising Three Methods

The rising three methods pattern is the opposite of the previous one, and can be observed during uptrends. The pattern comprises a long green candle, followed by three small red candles and then another long green.
How to Read Candlestick Charts?
Candlestick charts are easy to read with some practice, as they contain plenty of information related to historical price data. Besides the candlestick patterns that we’ve discussed above, there are chart patterns formed by multiple candlesticks organized in a certain way. Some examples are double tops and double bottoms, flags and pennants, and more.
Even novice or advanced traders can read a candlestick chart by visually examining the general trend. These visuals usually provide sufficient insight to help traders identify specific patterns in the candlesticks and their formations, especially at resistance and support levels.
Why Using Candlestick Patterns is a Good Choice?
Candlestick patterns give cryptocurrency traders more clarity about potential moves expected to come. In other words, they act as signals, helping traders decide when to open long or short positions and when to enter or exit the market. For example, swing traders rely on candlestick charts for swing trading indicators to determine reversal and continuation trading patterns.
Candlestick charts and their patterns help traders determine trends, understand momentum and realize the current market sentiment in real time.
How to Memorize Candlestick Patterns Quickly?
To quickly spot candlestick patterns, a trader needs to become familiar with them by watching charts and trading with small amounts of funds. A great way to start is by highlighting an individual candle formation and dissecting the candle for two-stick patterns.
It’s best to start with a pattern and learn it until you feel confident that you can easily spot it while the price is fluctuating.
Most Common Terms Used in Candlestick Charts
Here are a few terms based on candlestick charts to revisit whenever you trade:
- Emerging patterns — candlestick patterns that haven’t yet formed but are in progress
- Completed patterns — these are the patterns that have already developed, and can be regarded as either bullish or bearish signals
- Open — the opening price of a candle
- Close — the closing price of a candle
- High — the highest level the price reached during the period covered by the candle
- Low — the lowest level the price touched during the period covered by the candle
Different Candlestick Patterns – Summary
Bullish candlestick patterns:
- Inverted Hammer
- Bullish Engulfing
- Cup and Handle
- Morning Star
- Three White Soldiers
- Hammer
- Triple Top and Bottom
- Falling Wedge
- Dragonfly Doji
Bearish candlestick patterns:
- Bear Flag
- Gravestone Doji
- Head and Shoulders
- Dark Cloud Cover
- Shooting Star
- Rising Wedge
- Hanging Man
- Bear Pennant
- Evening Star
- Triple Top and Bottom
Other candlestick patterns:
- Harami Candlestick — Both bullish and bearish candlestick
- Hammer Candlestick — Both bullish and bearish candlestick
- Double Top and Bottom — Both bullish and bearish candlestick
- Spinning Top Candle — Both bullish and bearish candlestick
- Marubozu Candlestick — Both bullish and bearish candlestick
- Tweezer Bottom — Both bullish and bearish candlestick
- Continuation Patterns — Used for determining a continuing trend
Bottom Line
Candlestick patterns should be in the arsenal of every cryptocurrency trader, including crypto day traders, because they demonstrate the same efficiency as in the forex or stock markets.
While they can provide significant individual trading signals, we recommend combining these patterns with technical analysis indicators in order to either confirm or invalidate them.
FAQs
Can candlestick patterns be used to predict market trend reversals?
Yes. Some candlestick patterns are used to do precisely that — predict trend reversals. However, this doesn’t mean they can guarantee success all of the time.
Is a candlestick chart different from a bar chart?
Yes. The candlestick chart is different from the bar chart, but the two do share some similarities as they both display the same amount of price data. However, most traders agree that candlestick charts are easier to use and read.
|
BTCC Starter Rewards |
Read More:
XRP Price Prediction $500: Can XRP Reach $500 Dollars?
Luna Classic Price Prediction: Will Luna Classic Reach $1?
Will Pi Network Ever Launch? What Stage is Pi Network Now?
Is Pi Network Legit Or Scam: Pi Cryptocurrency Real or Fake?
Pi Coin Price Prediction: Will Pi Ever Be Worth Money?
Gold Price Predictions for Next 5 Years
Silver Price Predictions for Next 5 Years
Pepe Price Prediction 2023, 2025, 2030
How to Buy Pikamoon? Is It a Good Buy?
PulseX Price Prediction 2023, 2025, 2030: Can PulseX Reach $1?
Ethereum Price Prediction 2023, 2025, 2030
Bitcoin (BTC) Price Prediction 2023, 2024, 2025, 2030
Sui (SUI) Price Prediction 2023, 2025, 2030
Milady Meme Coin (LADYS) Price Prediction 2023, 2025, 2030
Wild Cash App: Answer Quiz to Earn $HOOK
Pulsechain Mainnet Goes Live – What Exactly is Pulsechain?
Pulsechain (PLS) Price Prediction 2023, 2025, 2030
Cardano (ADA) Price Prediction 2023, 2025, 2030
HBAR Price Prediction 2025, 2030
Stellar Lumens (XLM) Price Prediction 2023, 2025, 2030
Arbitrum (ARB) Price Prediction 2023, 2025, 2030
The Sandbox Price Prediction 2025, 2030
Polkadot (DOT) Price Prediction 2023, 2025, 2030
Can Solana Reach $1,000? Solana Price Prediction
Gala (GALA) Price Prediction 2023, 2025, 2030
Litecoin (LTC) Price Prediction 2023, 2025, 2030
Polygon (MATIC) Price Prediction 2023, 2025, 2030
VeChain (VET) Price Prediction 2023, 2025, 2030
Filecoin (FIL) Price Prediction 2023, 2025, 2030
Core DAO Airdrop is Now Available, How to Claim It?