XRP News: A Critical Warning Signal Threatens the Rally – Key Insights for 2025

- Why Are Long-Term XRP Holders Triggering Alarm Bells?
- Short-Term Holders Defy Expectations – What’s Their Game?
- Critical Price Levels: Where’s XRP Headed Next?
- Historical Parallels: Should Traders Brace for Impact?
- FAQ: Your XRP Market Questions Answered
XRP's bullish momentum faces a red flag as long-term holders accelerate selling, mirroring a pattern that triggered a 12% drop in November 2024. While short-term holders show unusual accumulation behavior, the Net Unrealized Profit/Loss (NUPL) metric suggests long-term investors are cashing out NEAR local tops. With critical support at $2.06 and resistance at $2.24, XRP's next move hinges on whether institutional money flows can offset this sell-side pressure. Here's what the data reveals about this make-or-break moment for XRP.
Why Are Long-Term XRP Holders Triggering Alarm Bells?
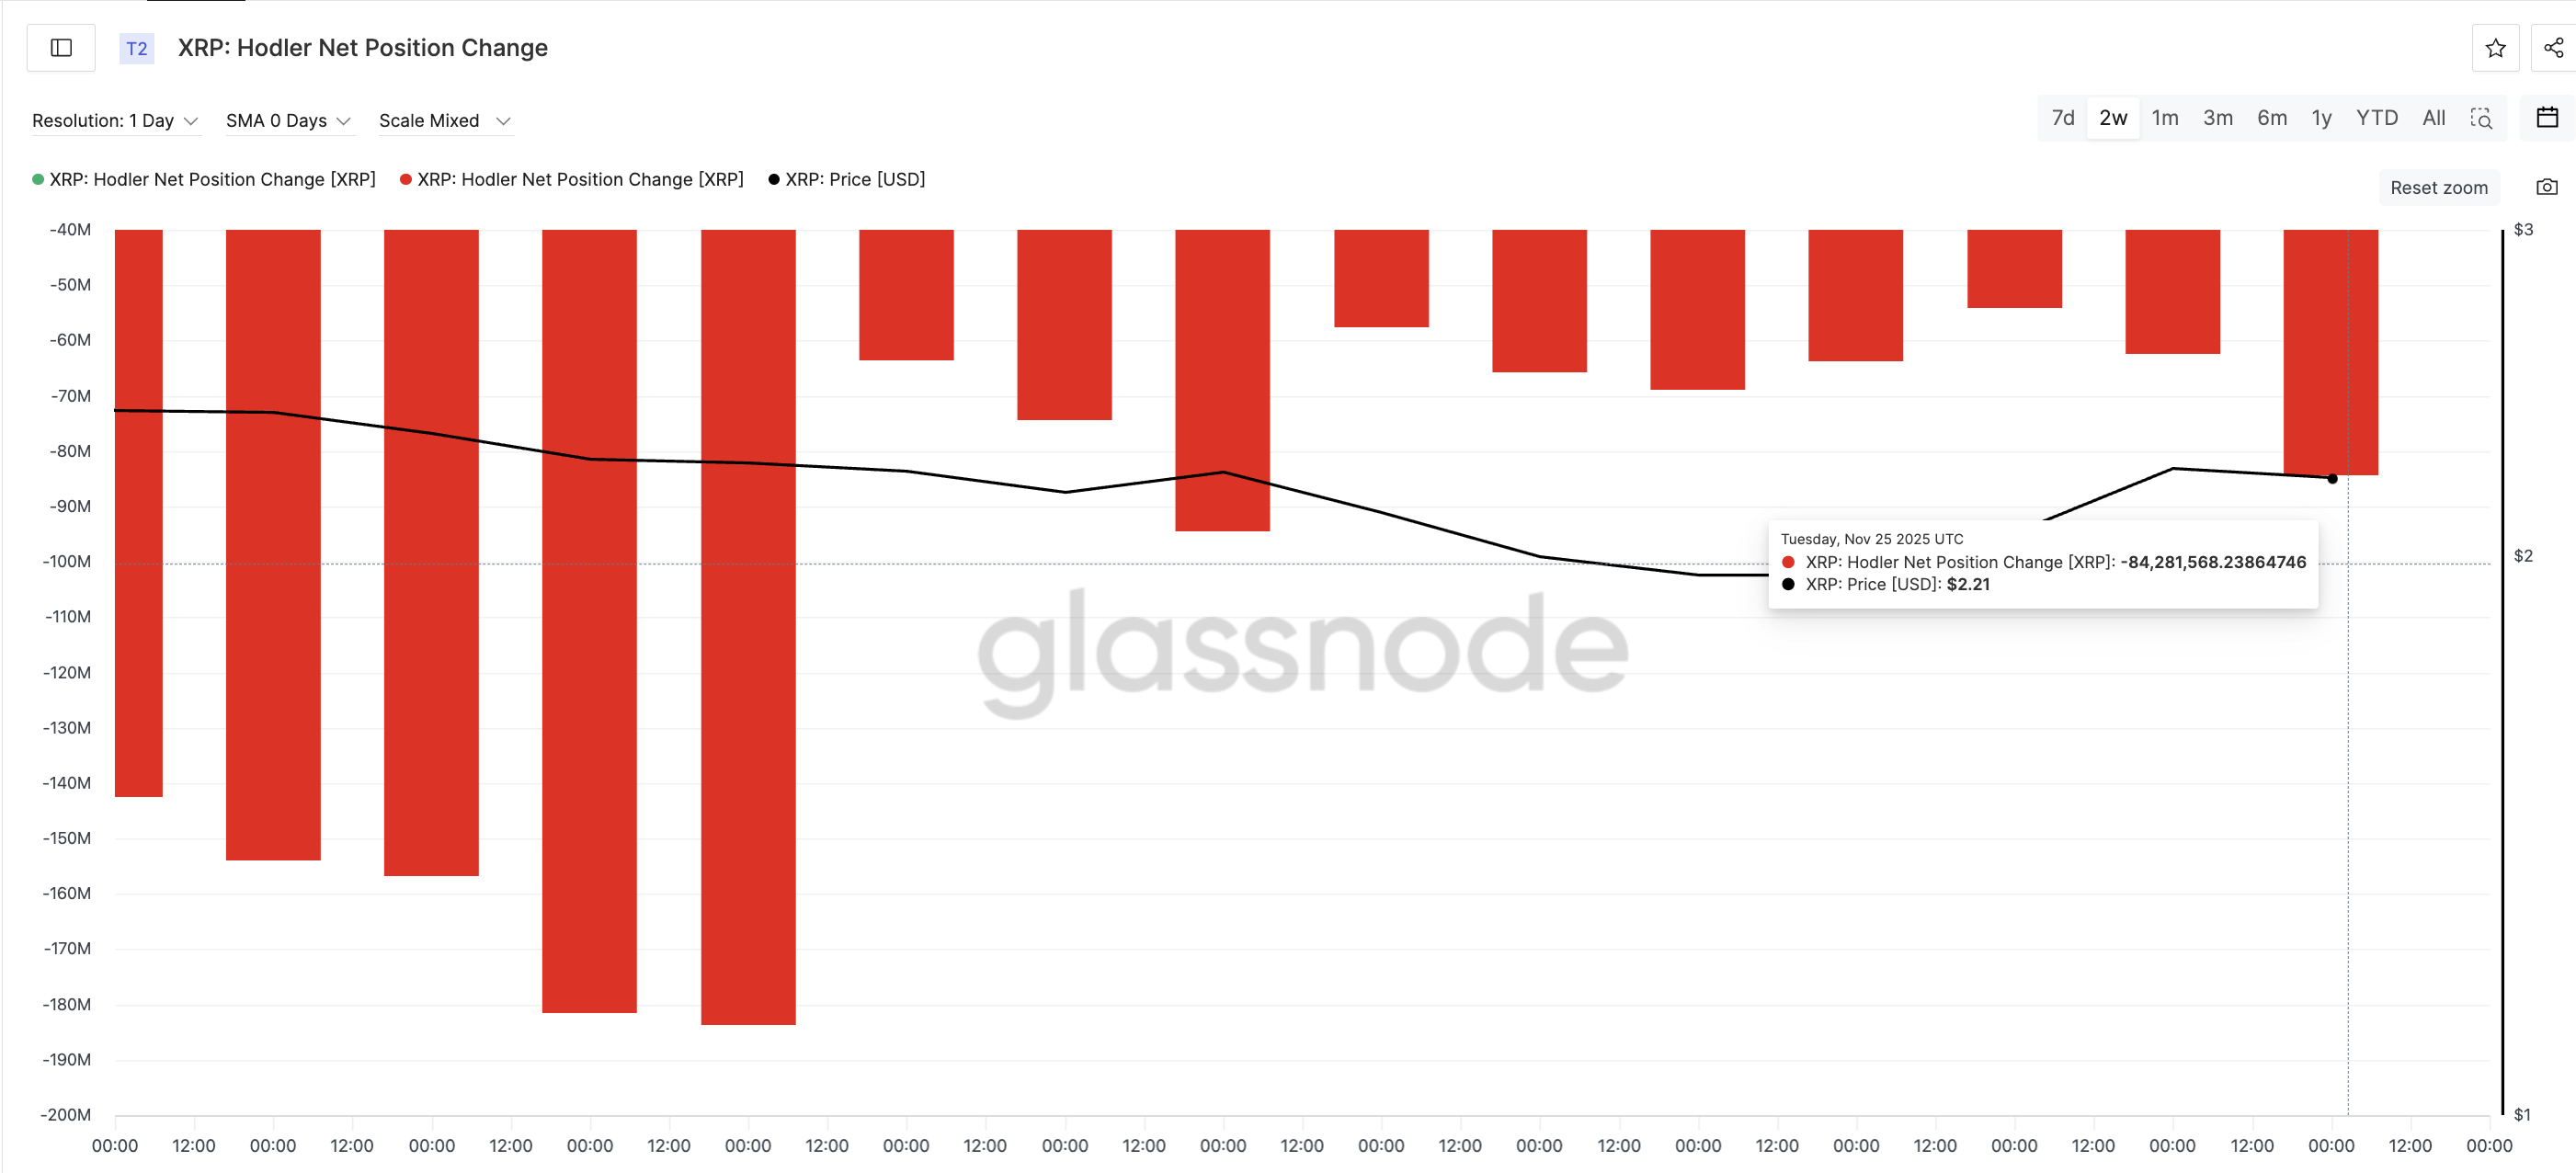
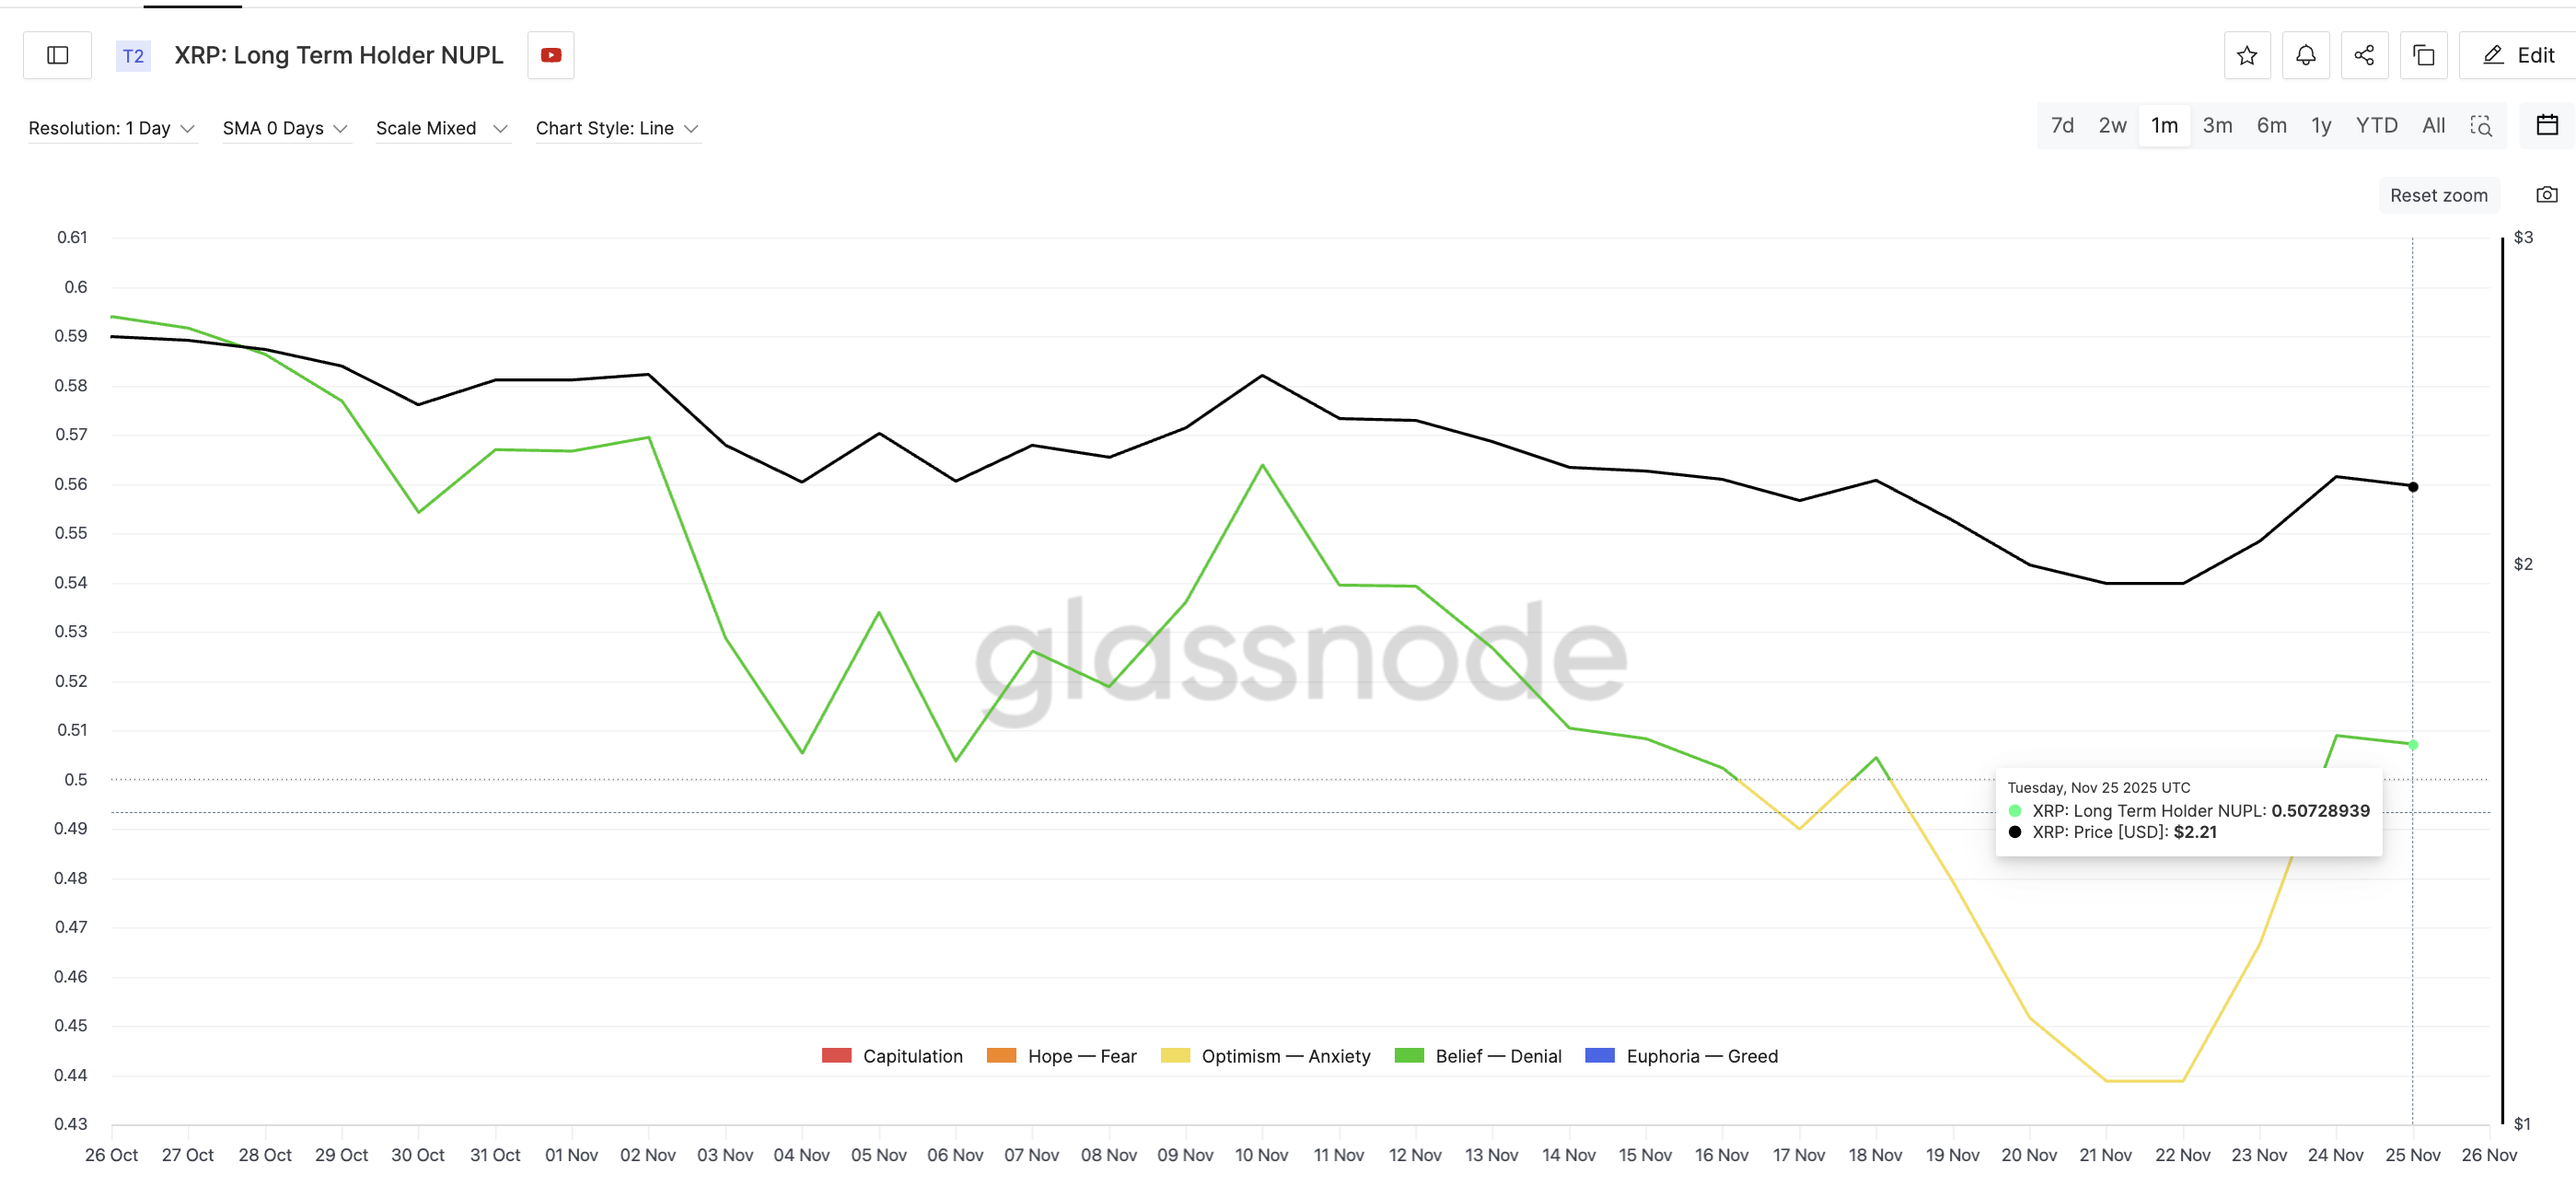
Glassnode's Holder Net Position Change metric paints a concerning picture: long-term XRP wallets dumped 54 million tokens on November 23, 2024, escalating to 84 million (a 56% surge) by November 25. This isn't an isolated event – similar selling between November 16-18 preceded XRP's 12% crash from $2.22 to $1.96. The NUPL indicator, currently at 0.50, confirms these investors are operating in the "belief-denial" zone where local tops frequently form. When profits reach this level, veteran holders historically take money off the table.
Short-Term Holders Defy Expectations – What’s Their Game?
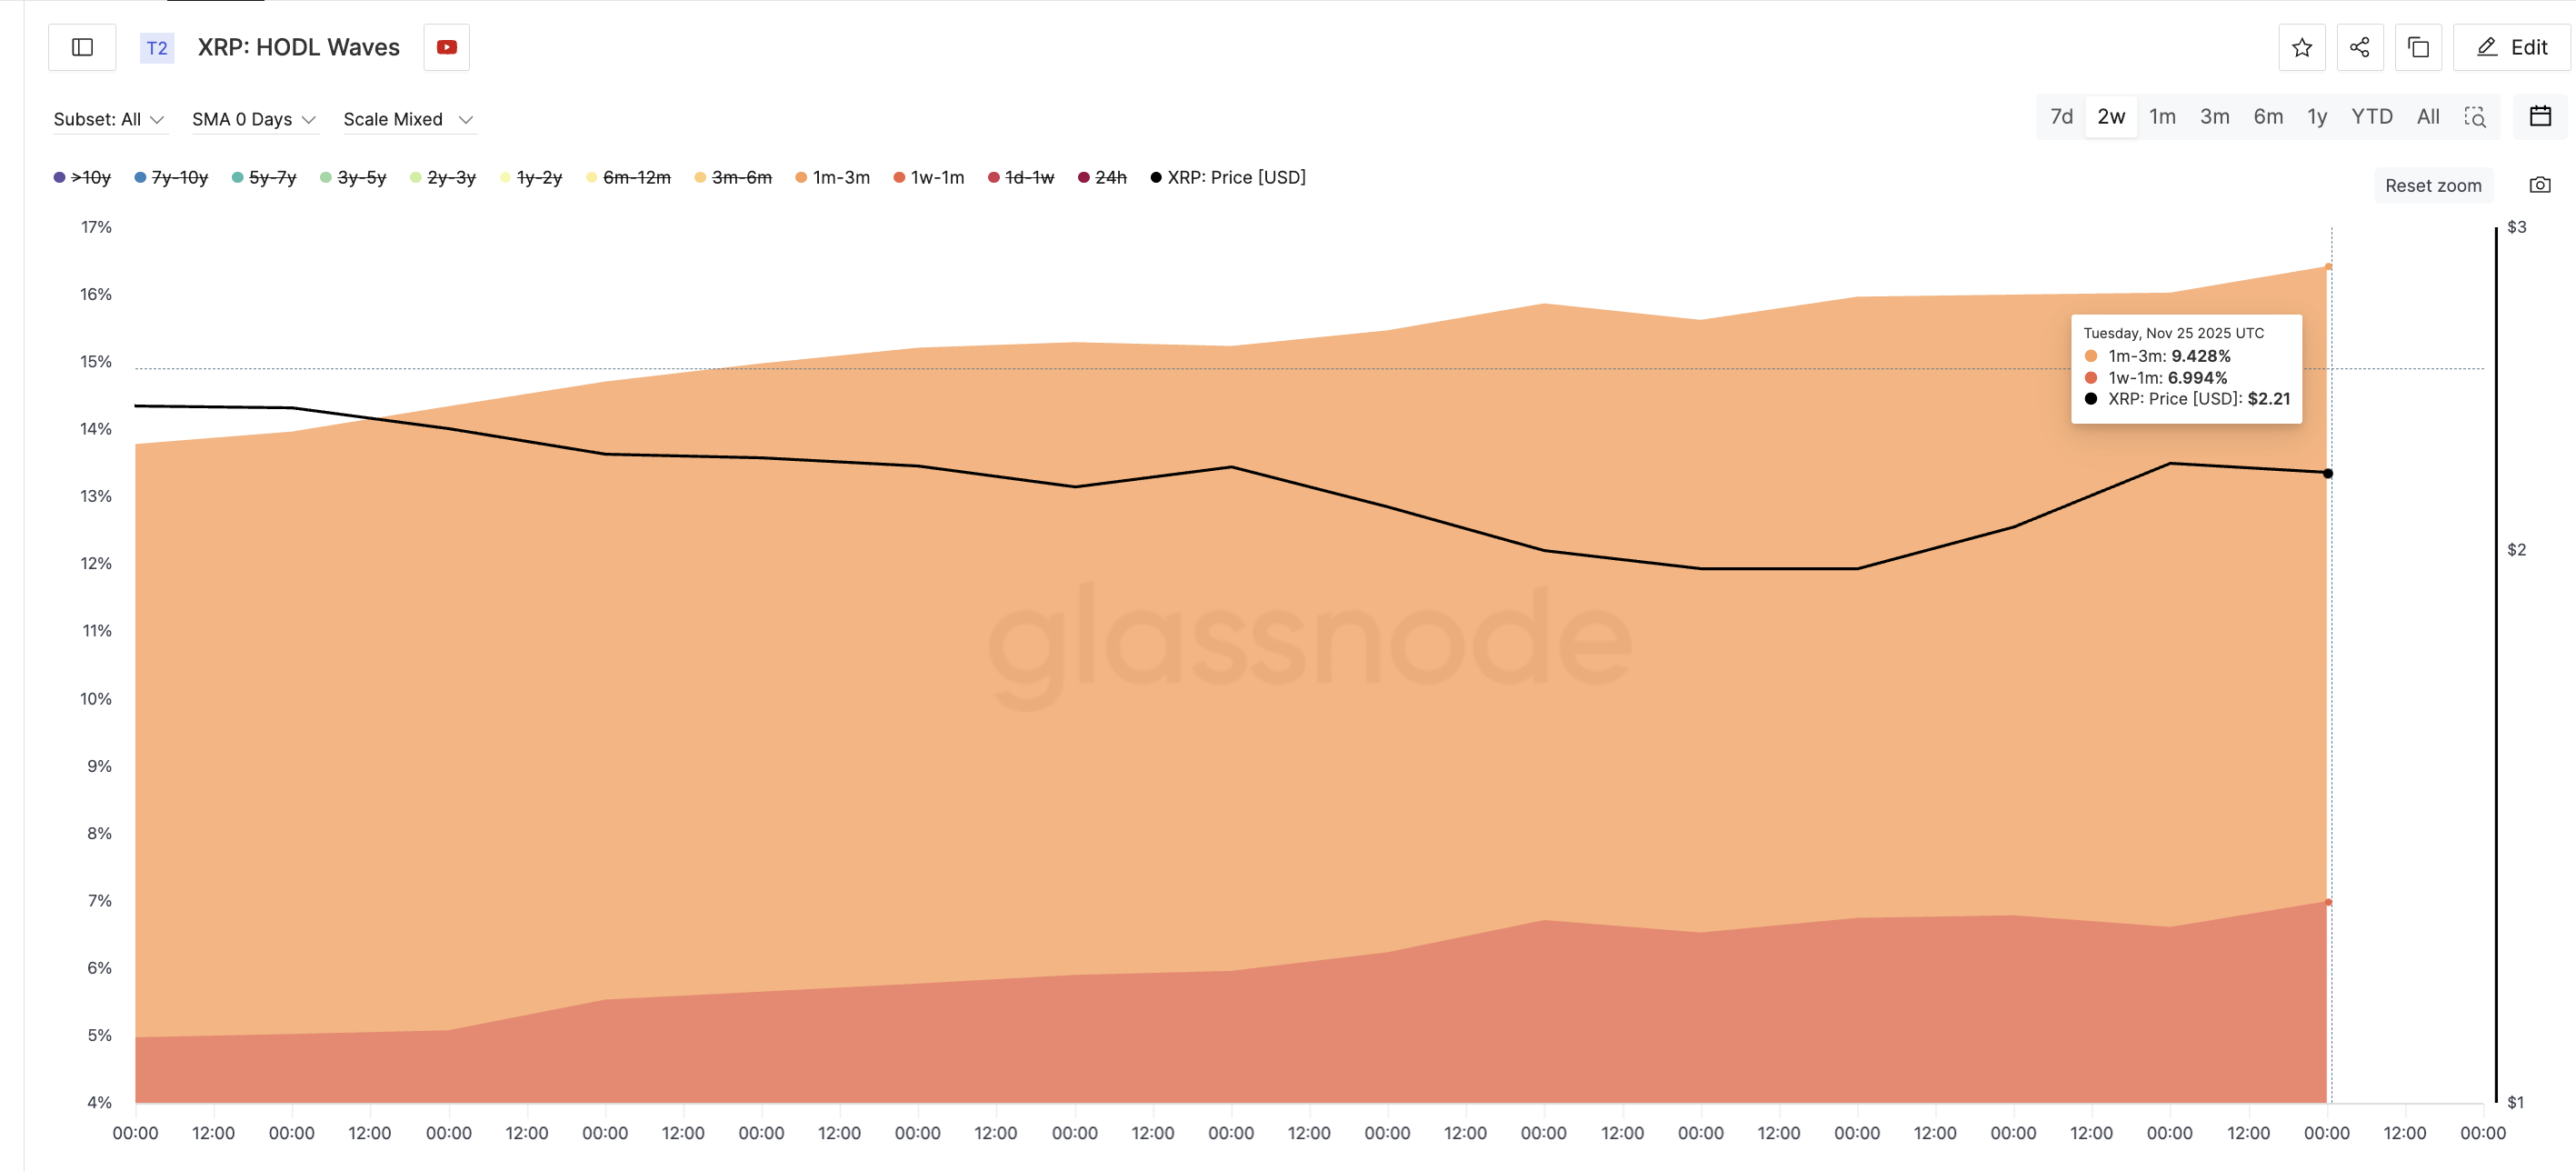
In a surprising twist, HODL Waves data reveals short-term holders (1-3 month cohort) increased their holdings from 8.80% to 9.48% since November 11, while the 1-week to 1-month group grew from 4.97% to 6.99%. Typically quick to sell during volatility, these traders are accumulating instead. The BTCC research team suggests this could indicate anticipation of a breakout above $2.24, though the lack of strong money inflows (Chaikin Money Flow barely above zero) tempers optimism.
Critical Price Levels: Where’s XRP Headed Next?
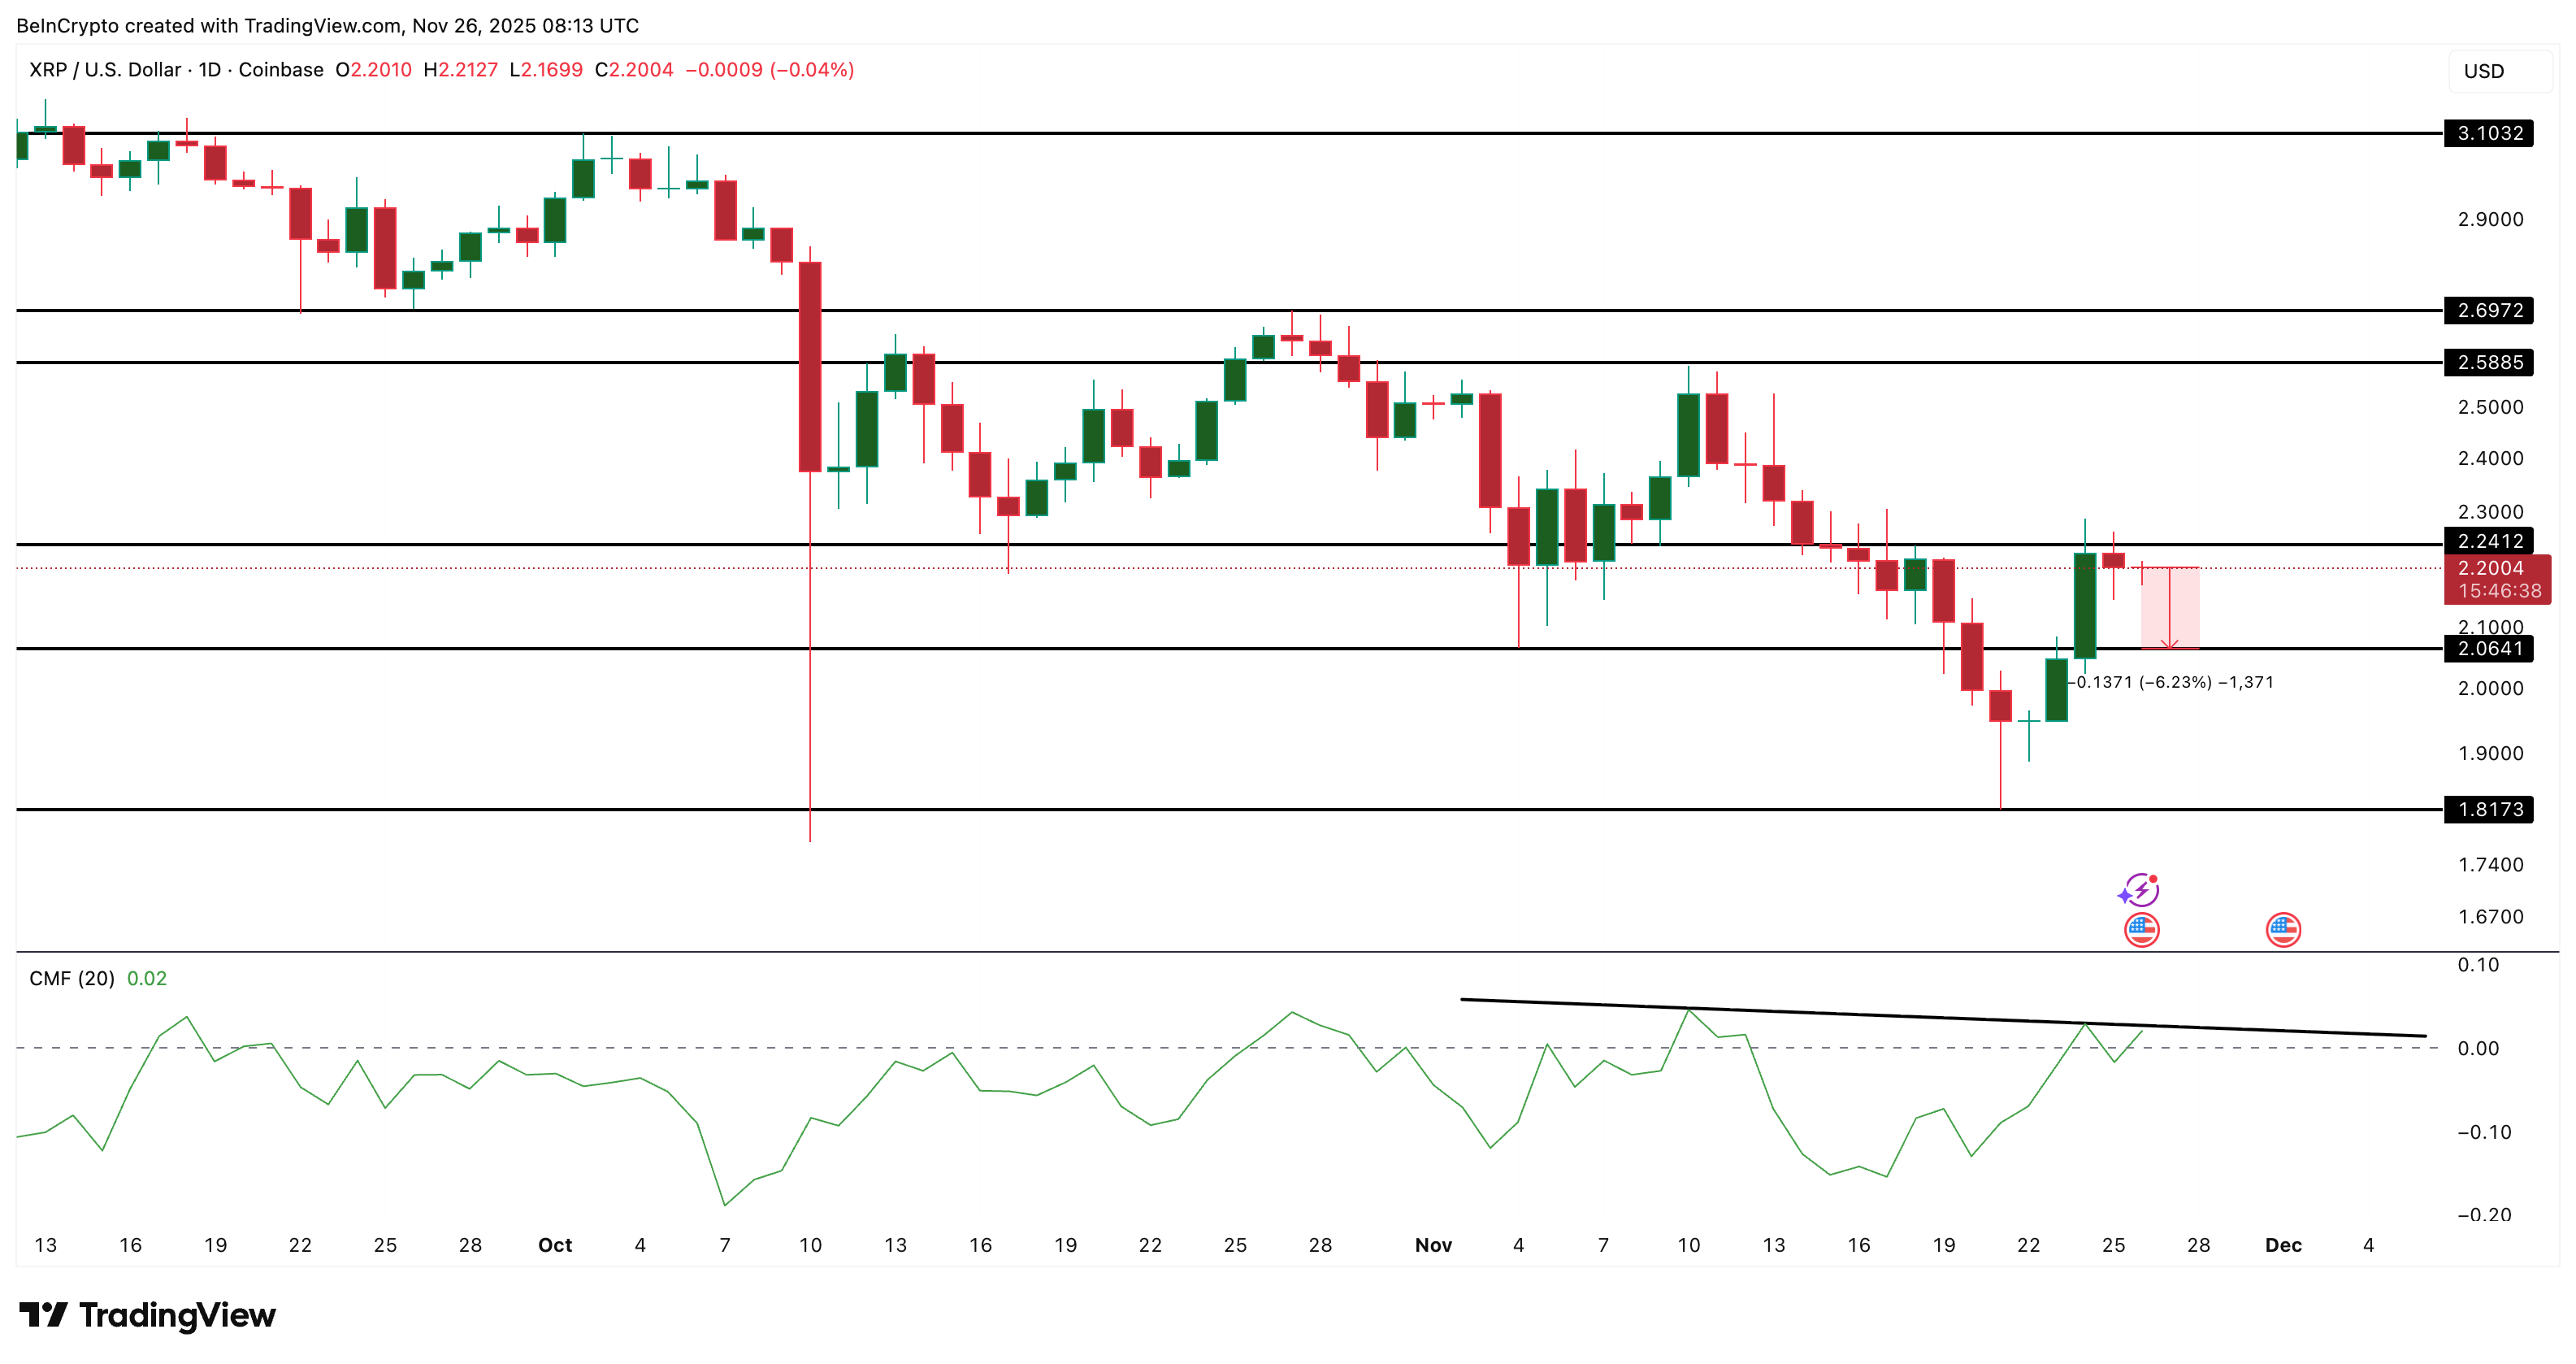
TradingView charts identify three decisive thresholds:
- Support: $2.06 (loss risks retest of $1.81 November low)
- Pivot: $2.24 (confirmed close needed for bullish reversal)
- Targets: $2.58 and $2.69 (previous resistance zones)
The Chaikin Money Flow's persistent downtrend suggests institutional buyers aren't yet committing sufficient capital to absorb long-term holder sales. Until this trendline breaks, rallies may remain capped.
Historical Parallels: Should Traders Brace for Impact?
The current setup eerily mirrors November's sell-off when NUPL hit 0.50. Back then, XRP corrected within 48 hours of the indicator entering the danger zone. With the metric flashing identical warnings now, seasoned traders are watching two factors: 1) whether the 84 million XRP sell-off accelerates, and 2) if Coinmarketcap's exchange netflows show increasing exchange deposits (a bearish signal). The last time these aligned, the drop was swift and brutal.
FAQ: Your XRP Market Questions Answered
What’s causing long-term XRP holders to sell now?
The NUPL at 0.50 suggests these investors are sitting on substantial paper profits. Historical patterns show they tend to realize gains at this level before potential pullbacks.
Can XRP maintain its weekly gains despite the selling pressure?
It’s possible if the Chaikin Money FLOW reverses its downtrend. Currently, money inflows are insufficient to offset the sell-side pressure from long-term holders.
How reliable is the NUPL indicator for predicting XRP tops?
While not perfect, NUPL accurately flagged November's local top. The same signal appearing now warrants caution, though breakout scenarios still exist if $2.24 breaks decisively.
