How to Read BTC – Bitcoin Charts
Bitcoin search term recently hits new highs on Google trends as institutional money flows into the crypto space. It begs the question, “how does one read Bitcoin charts and find meaningful insights?”
Before we dive into ways we can read Bitcoin charts, let’s look into why we would want to read the Bitcoin charts in the first place.
Well, if you’ve been following the cryptocurrency space since 2016 into 2017, you’ll understand that Bitcoin usually explodes into a parabolic wave after every halving that takes place every four years.
Now, what usually follows the parabolic impulse wave is a prolonged bearish wave popularly dubbed the crypto-winter.
With that said, just as it’s essential to know when the music will start, it’s also important to time when the music will stop.
There are different ways to read Bitcoin charts, the most popular being technical analysis. A rather indirect approach to reading Bitcoin chart is via on-chain analysis, looking at metrics like BTC miners’ reward chart and BTC hash rate.
In this post, we’ll consider the Inside-bar candlestick charts, bullish and bearish divergence structures, and golden/death cross of moving averages for technical analysis.
Let’s dive into it, shall we?
Candlestick Patterns and Technical Analysis
- Inside-bar Candlestick Patterns
- Divergence Patterns
- Golden/death cross of 10 and 20 (daily, weekly, and Monthly) Moving Averages
Inside-bar Candlestick Patterns
The inside-bar candlestick pattern is a popular Japanese candlestick pattern, also known as the Harami pattern, which also means pregnant candlestick.
This pattern is excellent for detecting trend continuation and reversals when used in combination with other chart patterns.
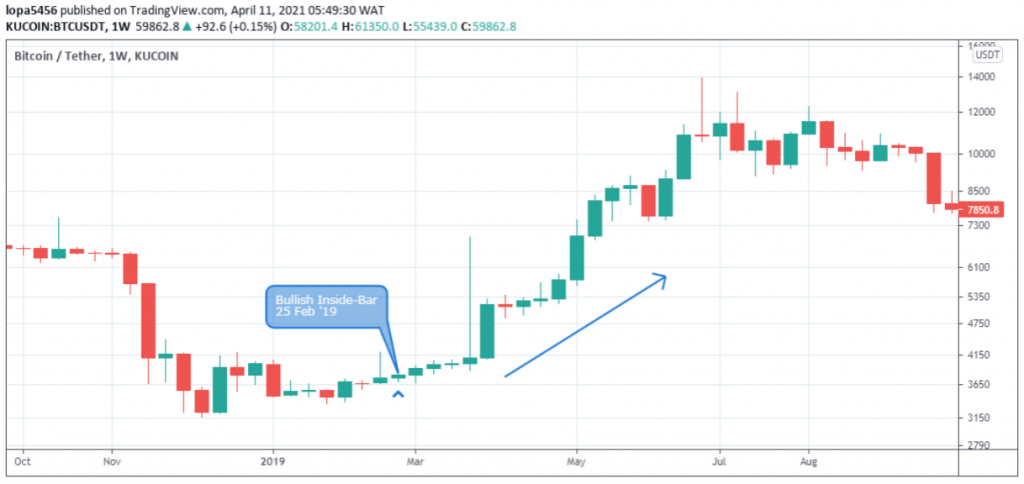
The pattern is made up of a longer bar/candlestick called the mother bar, and the smaller candlestick called the child bar.
First, both mother-bar and child-bar have to close bullish.
For the pattern to be confirmed, the child-bar’s high and low price has to be enclosed within the high and low of the mother-bar.
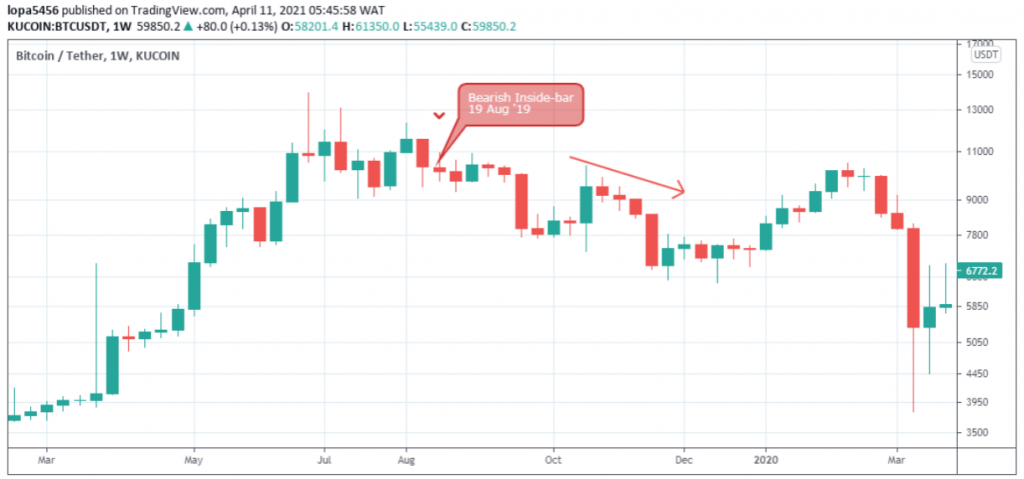
Here, the mother-bar and child-bar have to close bearish.
The child bar’s high and low price must also be enclosed within the mother bar’s high-low range.
Other Inside-bar Variants
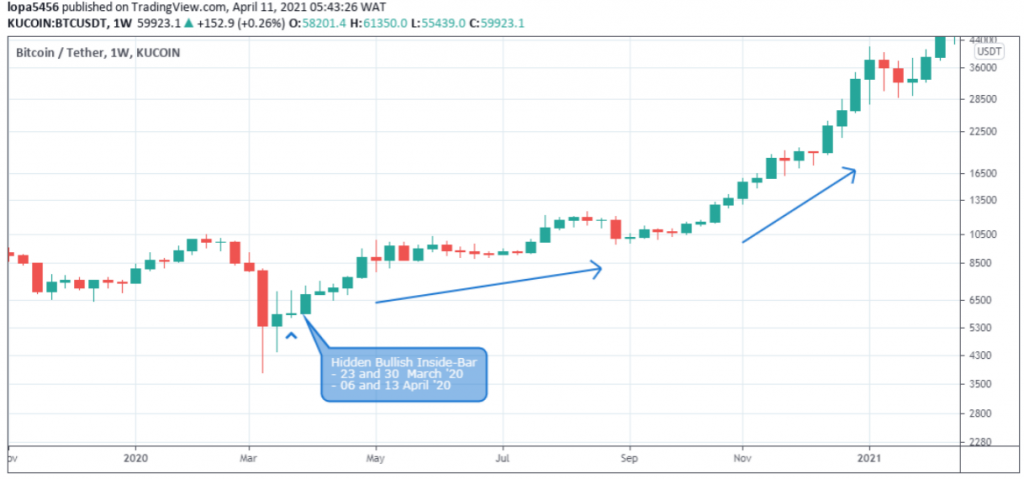
Hidden Bullish (Inside-bar Variant)
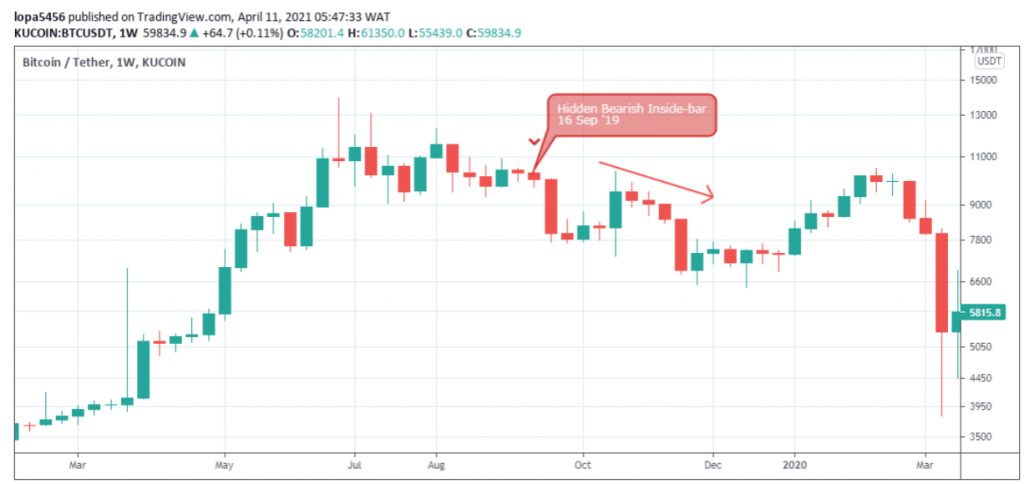
Hidden Bearish (Inside-bar Variant)

Both mother-bar and child-bar must close bullish.
Unlike the classic Inside-bar that considers the child bar’s high and low to be enclosed within the mother-bar, the hidden bullish variant only considers the child bar’s open and closing price to be confined within the high and low of the mother-bar.
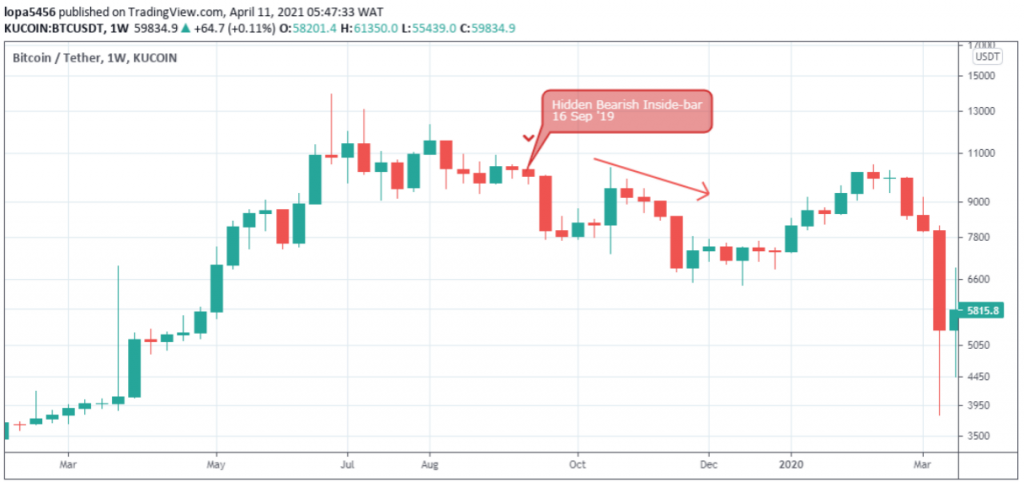
Both mother-bar and child-bar must close bearish.
In contrast to the classic Inside-bar, the hidden bearish Inside-bar considers only the candlestick body to close within the mother bar’s high-low range.
To emphasize, most of the Inside-bar patterns we’ll find on the Bitcoin charts are the hidden Inside-bar variants.
Breakout and Breakdown of Inside-bar Patterns
Breakdown of Hidden Bullish Inside Bar
Breakout of Hidden Bearish Inside Bar
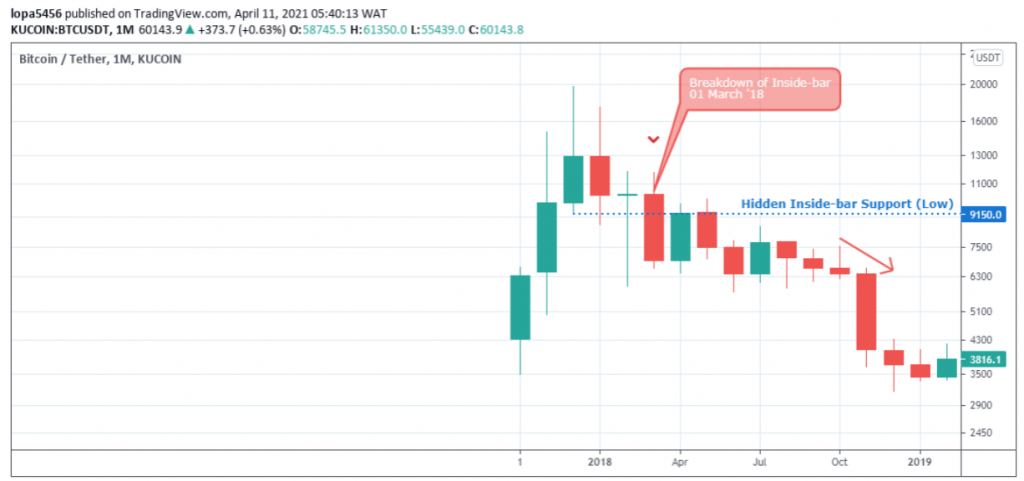
First, we identify a hidden bullish Inside-bar candlestick pattern.
Next, we lookout for a price close below the child bar’s low to confirm the pattern shown in the image above.
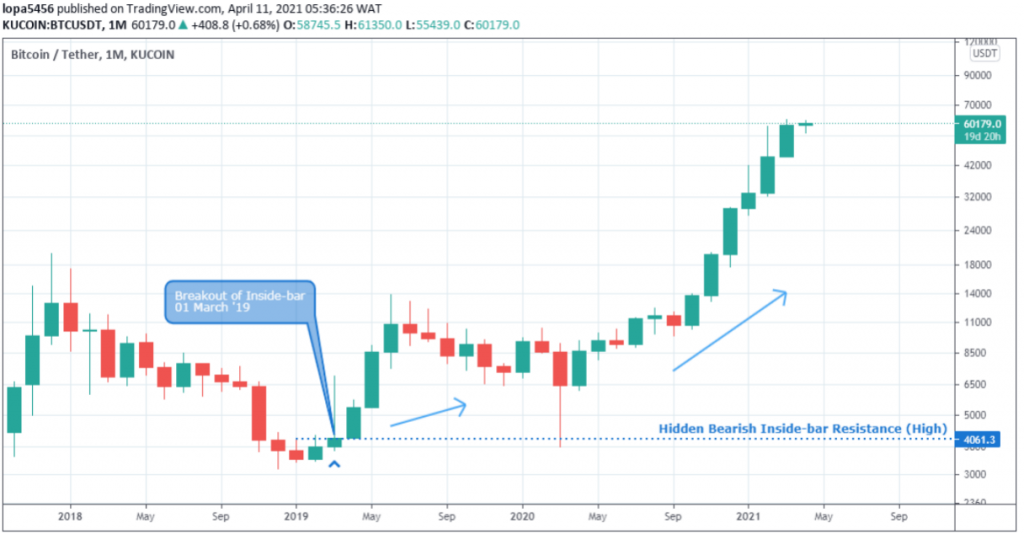
Upon identifying a hidden bearish Inside-bar pattern, we wait for a price close above the child-bar high to confirm the breakout as shown above.
Divergence Patterns
Divergence patterns are identified by comparing the Bitcoin price chart to an oscillator, e.g., the RSI – Relative Strength Index, Stochastics, or MACD – Moving Average Convergence divergence.
Usually, the oscillator considered would mimic the Bitcoin price.
A divergence pattern is formed when the oscillator forms a different chart structure opposite to the price chart. We’ll look into more details as we move on.
There are two types of divergence, namely, the Regular and Hidden divergence patterns.
Regular Divergence patterns
The regular divergence patterns, which can be regular bullish or regular bearish, generally shows a change in a trend’s direction.
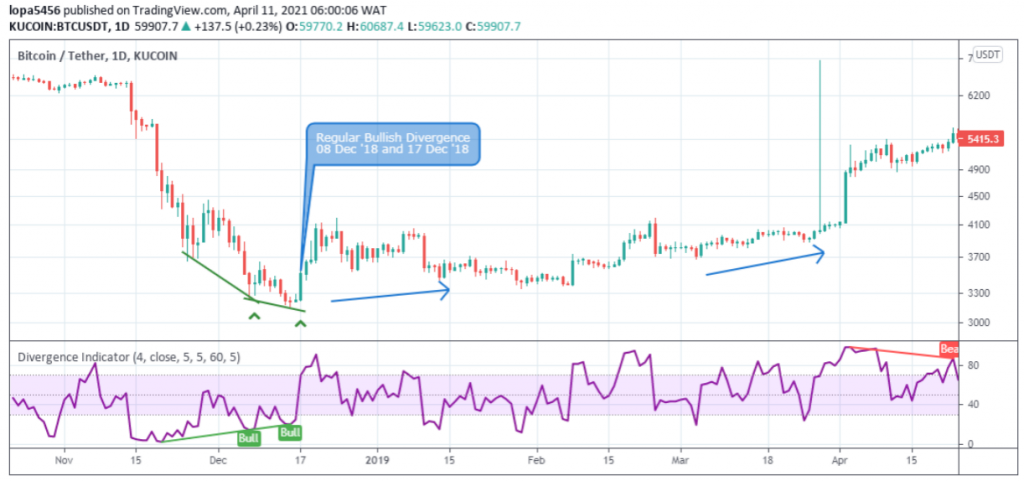
For a regular bullish divergence, the BTCUSD price chart sets a lower trough compared to the oscillators higher trough as shown in the image above.
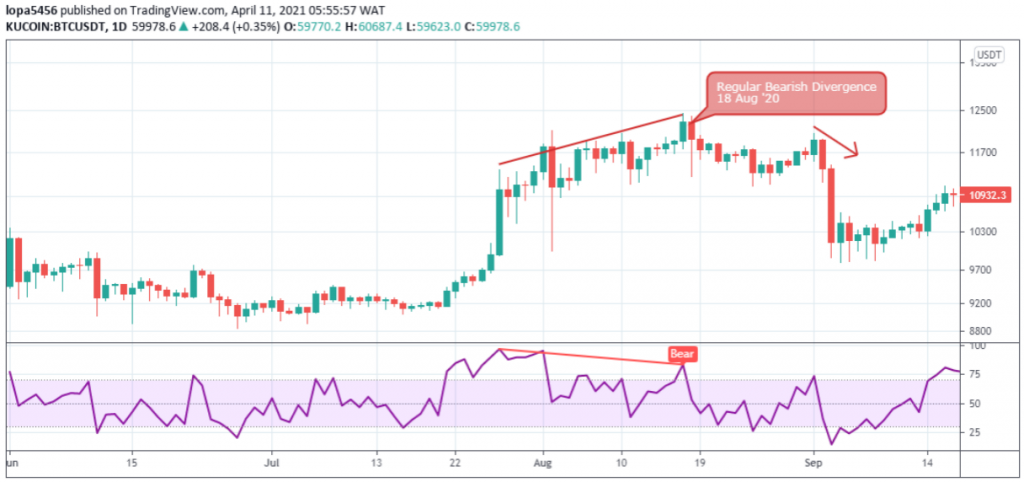
The Bitcoin price chart sets a higher peak than the oscillators’ lower peak, as shown above.
Hidden Divergence Patterns
The hidden divergence patterns, hidden bullish or hidden bearish, confirm the continuation of an uptrend or downtrend.
The Bitcoin vs. USD price chart forms a higher peak compared to the oscillators’ lower peak.
The Bitcoin price sets a lower peak in contrast to the oscillators’ higher peak.
Golden/death cross of 10 and 20 (daily, weekly, and Monthly) Moving Averages
By observing a fast and slow-moving average, we can time the up and down trends on a Bitcoin chart.
The recommended time frames for this approach are the daily, weekly, and monthly time frames.
For the faster-moving average, we consider the ten-period moving average MA-10 and the 20 periods moving average MA-20 for the slower moving average.
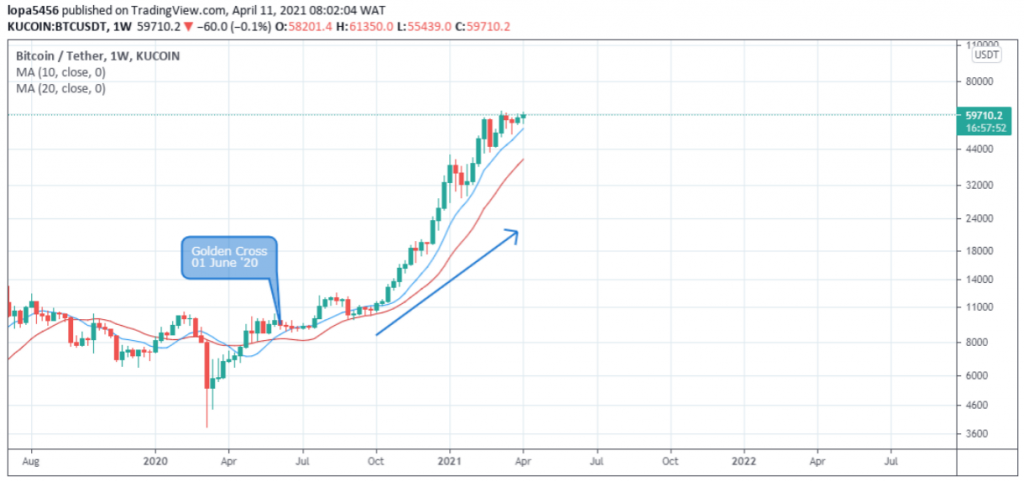
An uptrend is identified when the MA-10 is greater than the MA-20.
The MA-10 and MA-20 price zones can also be used as support areas to buy Bitcoin during the correction of an upward trend.
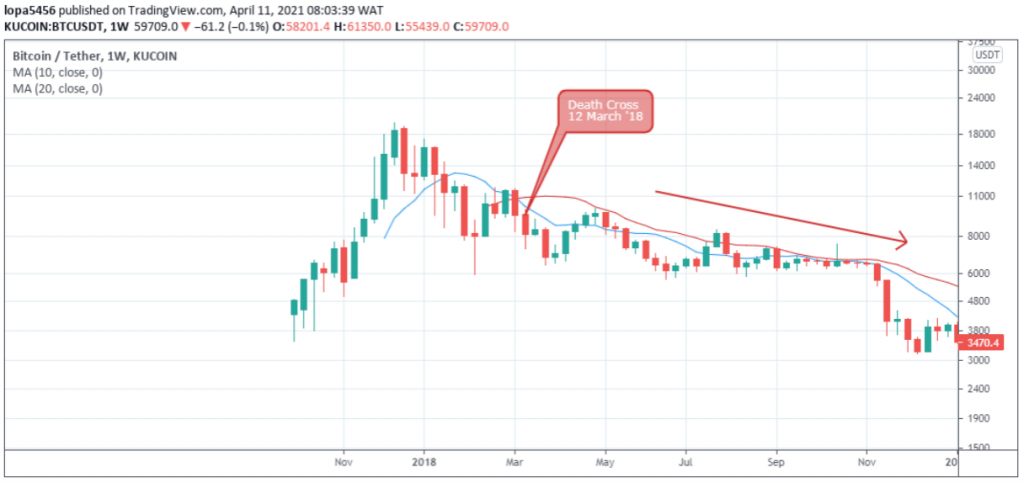
Death cross signals the start of a downtrend, which is spotted when the MA-10 is below the MA-20.
Similarly, the MA-10 and MA-20 can be used as resistance zones in a downtrend.
Conclusion
Note that you’ll get better results when a confluence of two or three of the patterns discussed is signaled on a Bitcoin chart. All the same, you can use the setups in isolation with a reasonable capital allocation.
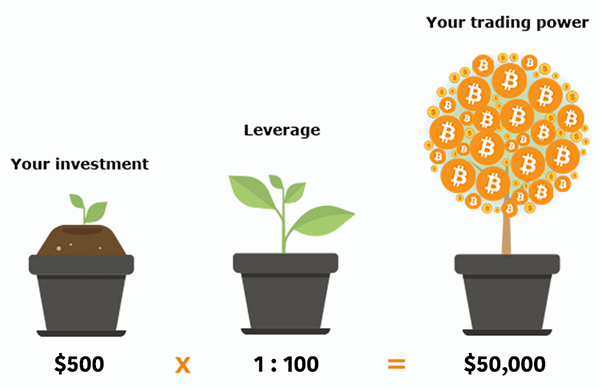
Go For A Free Account In Seconds On BTCC And Try Your First Bitcoin Leverage Trading. New Users Will Get Up To 2,000 USDT Bones!