Why These Altcoins Are Trending Today — February 13

Amid this positive market movement, some altcoins have gained significant traction, drawing attention due to their price action.
Berachain (BERA)
Layer-1 coin BERA is a trending altcoin today. It currently trades at $5.90, noting an 8% uptick in the past 24 hours.
However, its negative Chaikin Money Flow (CMF) on the four-hour chart signals a bearish divergence, suggesting a potential price correction in the near term. At press time, BERA’s CMF is below zero at -0.04.
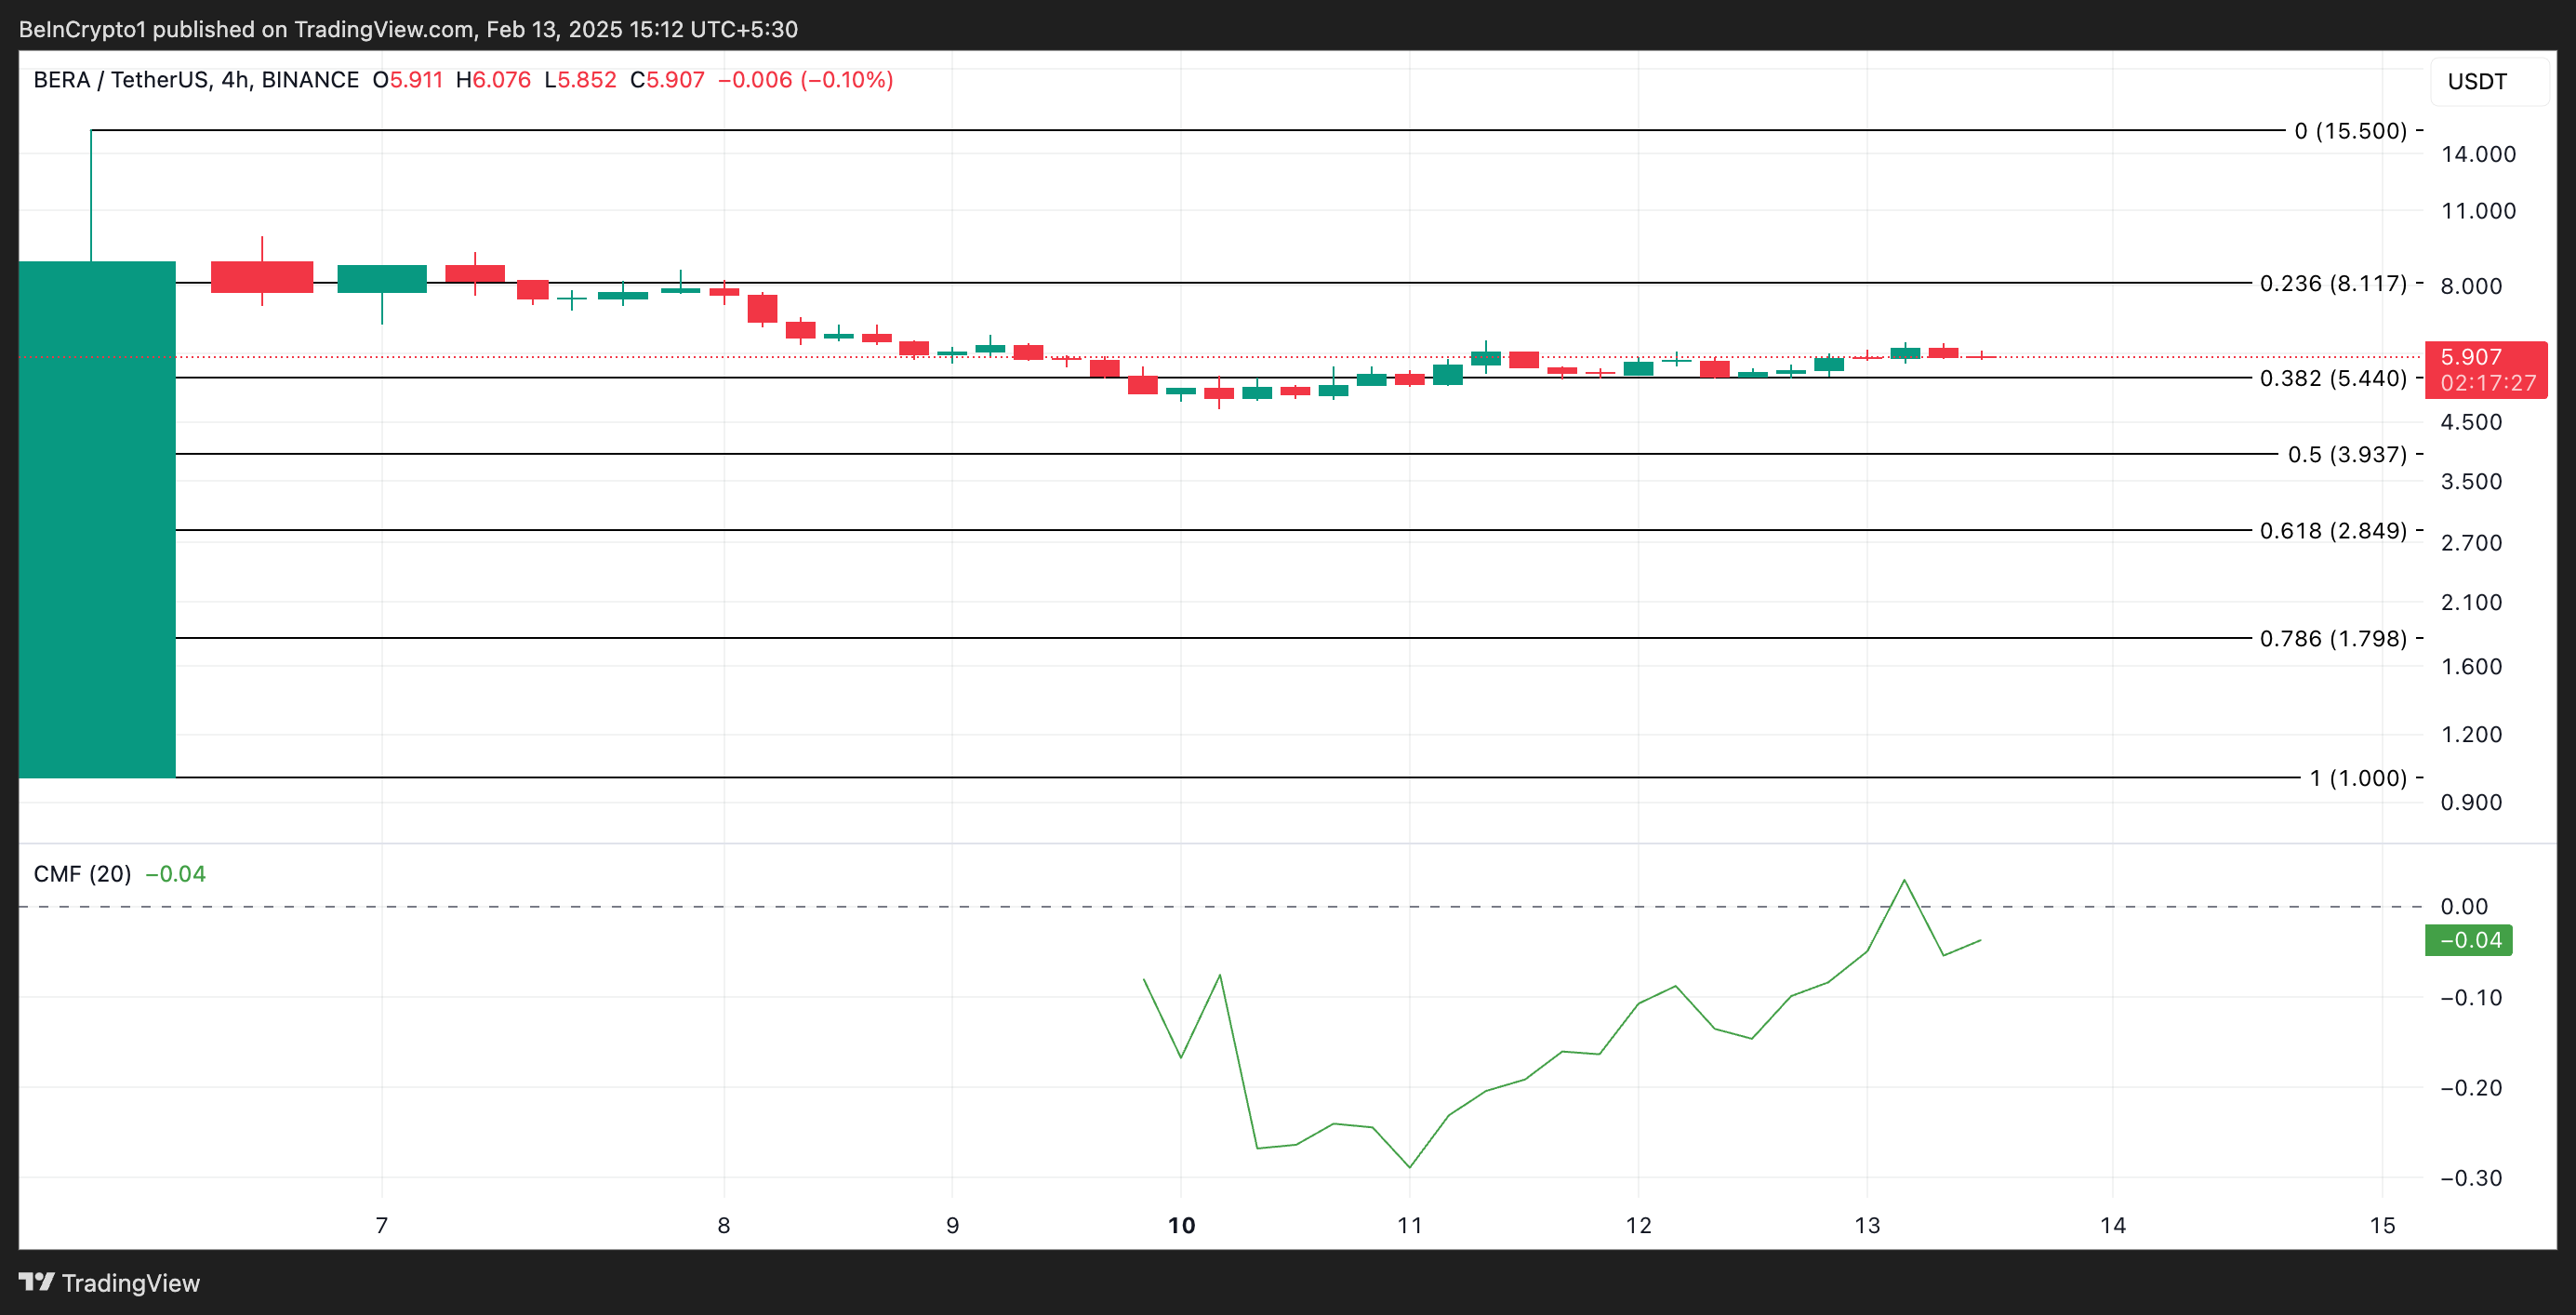
This indicator measures an asset’s buying and selling pressure by analyzing volume and price movement over a specific period. A bearish divergence is formed when an asset’s price rises while its CMF trends downward or turns negative. This divergence indicates weakening buying pressure and a potential price correction ahead.
If a correction happens, BERA’s price could fall below the support formed at $5.44 to trade at $3.93. On the other hand, if it maintains its current uptrend, its price could rally to $8.11.
Koma Inu (KOMA)
Described as the “son of SHIB and protector of BNB,” KOMA is a dog-themed meme coin, one of the most searched assets today. It trades at $0.06 at press time, and its price has surged 13% in the past 24 hours.
This double-digit rally marks a continuation of KOMA’s extended price rally, which began after it fell to an all-time low of $0.022 on February 3. Since then, the meme coin’s value has soared by 186%.
If this uptrend continues, KOMA could trade at $0.086.
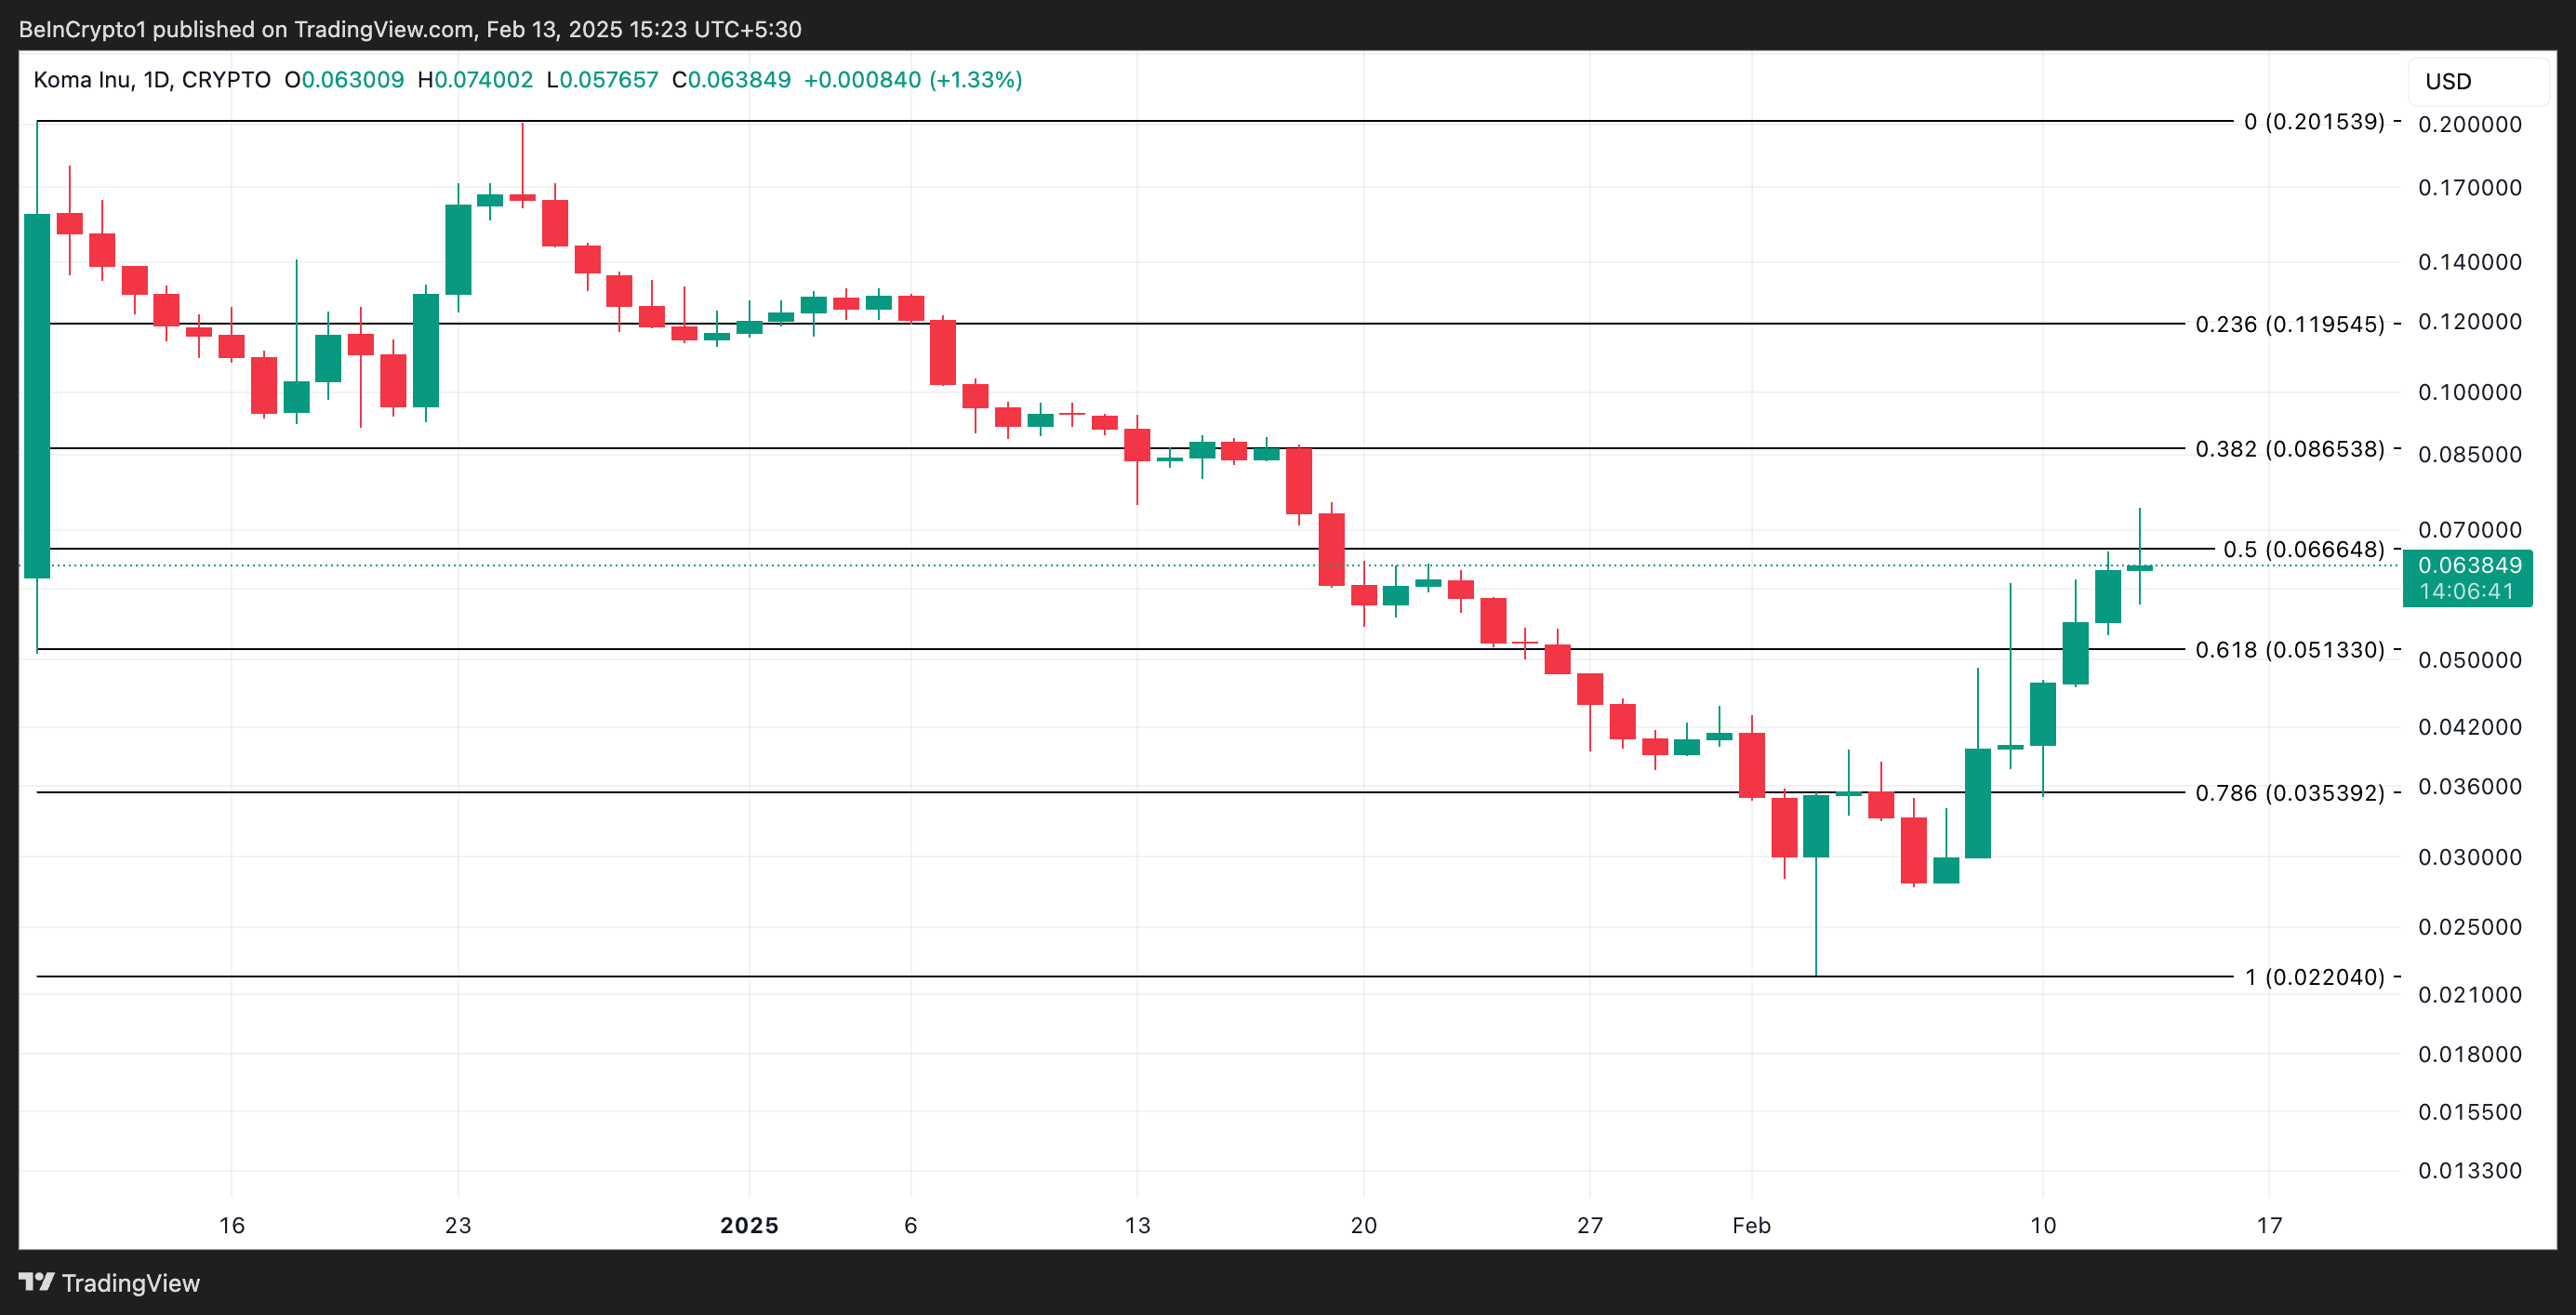
However, if profit-taking commences, its price could drop to $0.051.
Sonic (prev. FTM) (S)
Sonic’s S is another altcoin trending today. It exchanges hands at $0.55, and its price has increased by 17% over the past day.
According to the Moving Average Convergence Divergence (MACD) indicator, it is poised to extend its gains in the short term. At press time, the altcoin’s MACD line (blue) rests above its signal (yellow) line, indicating the bullish pressure in the market.
An asset’s MACD indicator identifies trends and momentum in its price movement. It helps traders spot potential buy or sell signals through crossovers between the MACD and signal lines. When set up this way, buying activity dominates the market, hinting at further price growth.
In this scenario, the value of Sonic could breach $0.59 to trade at $0.76.
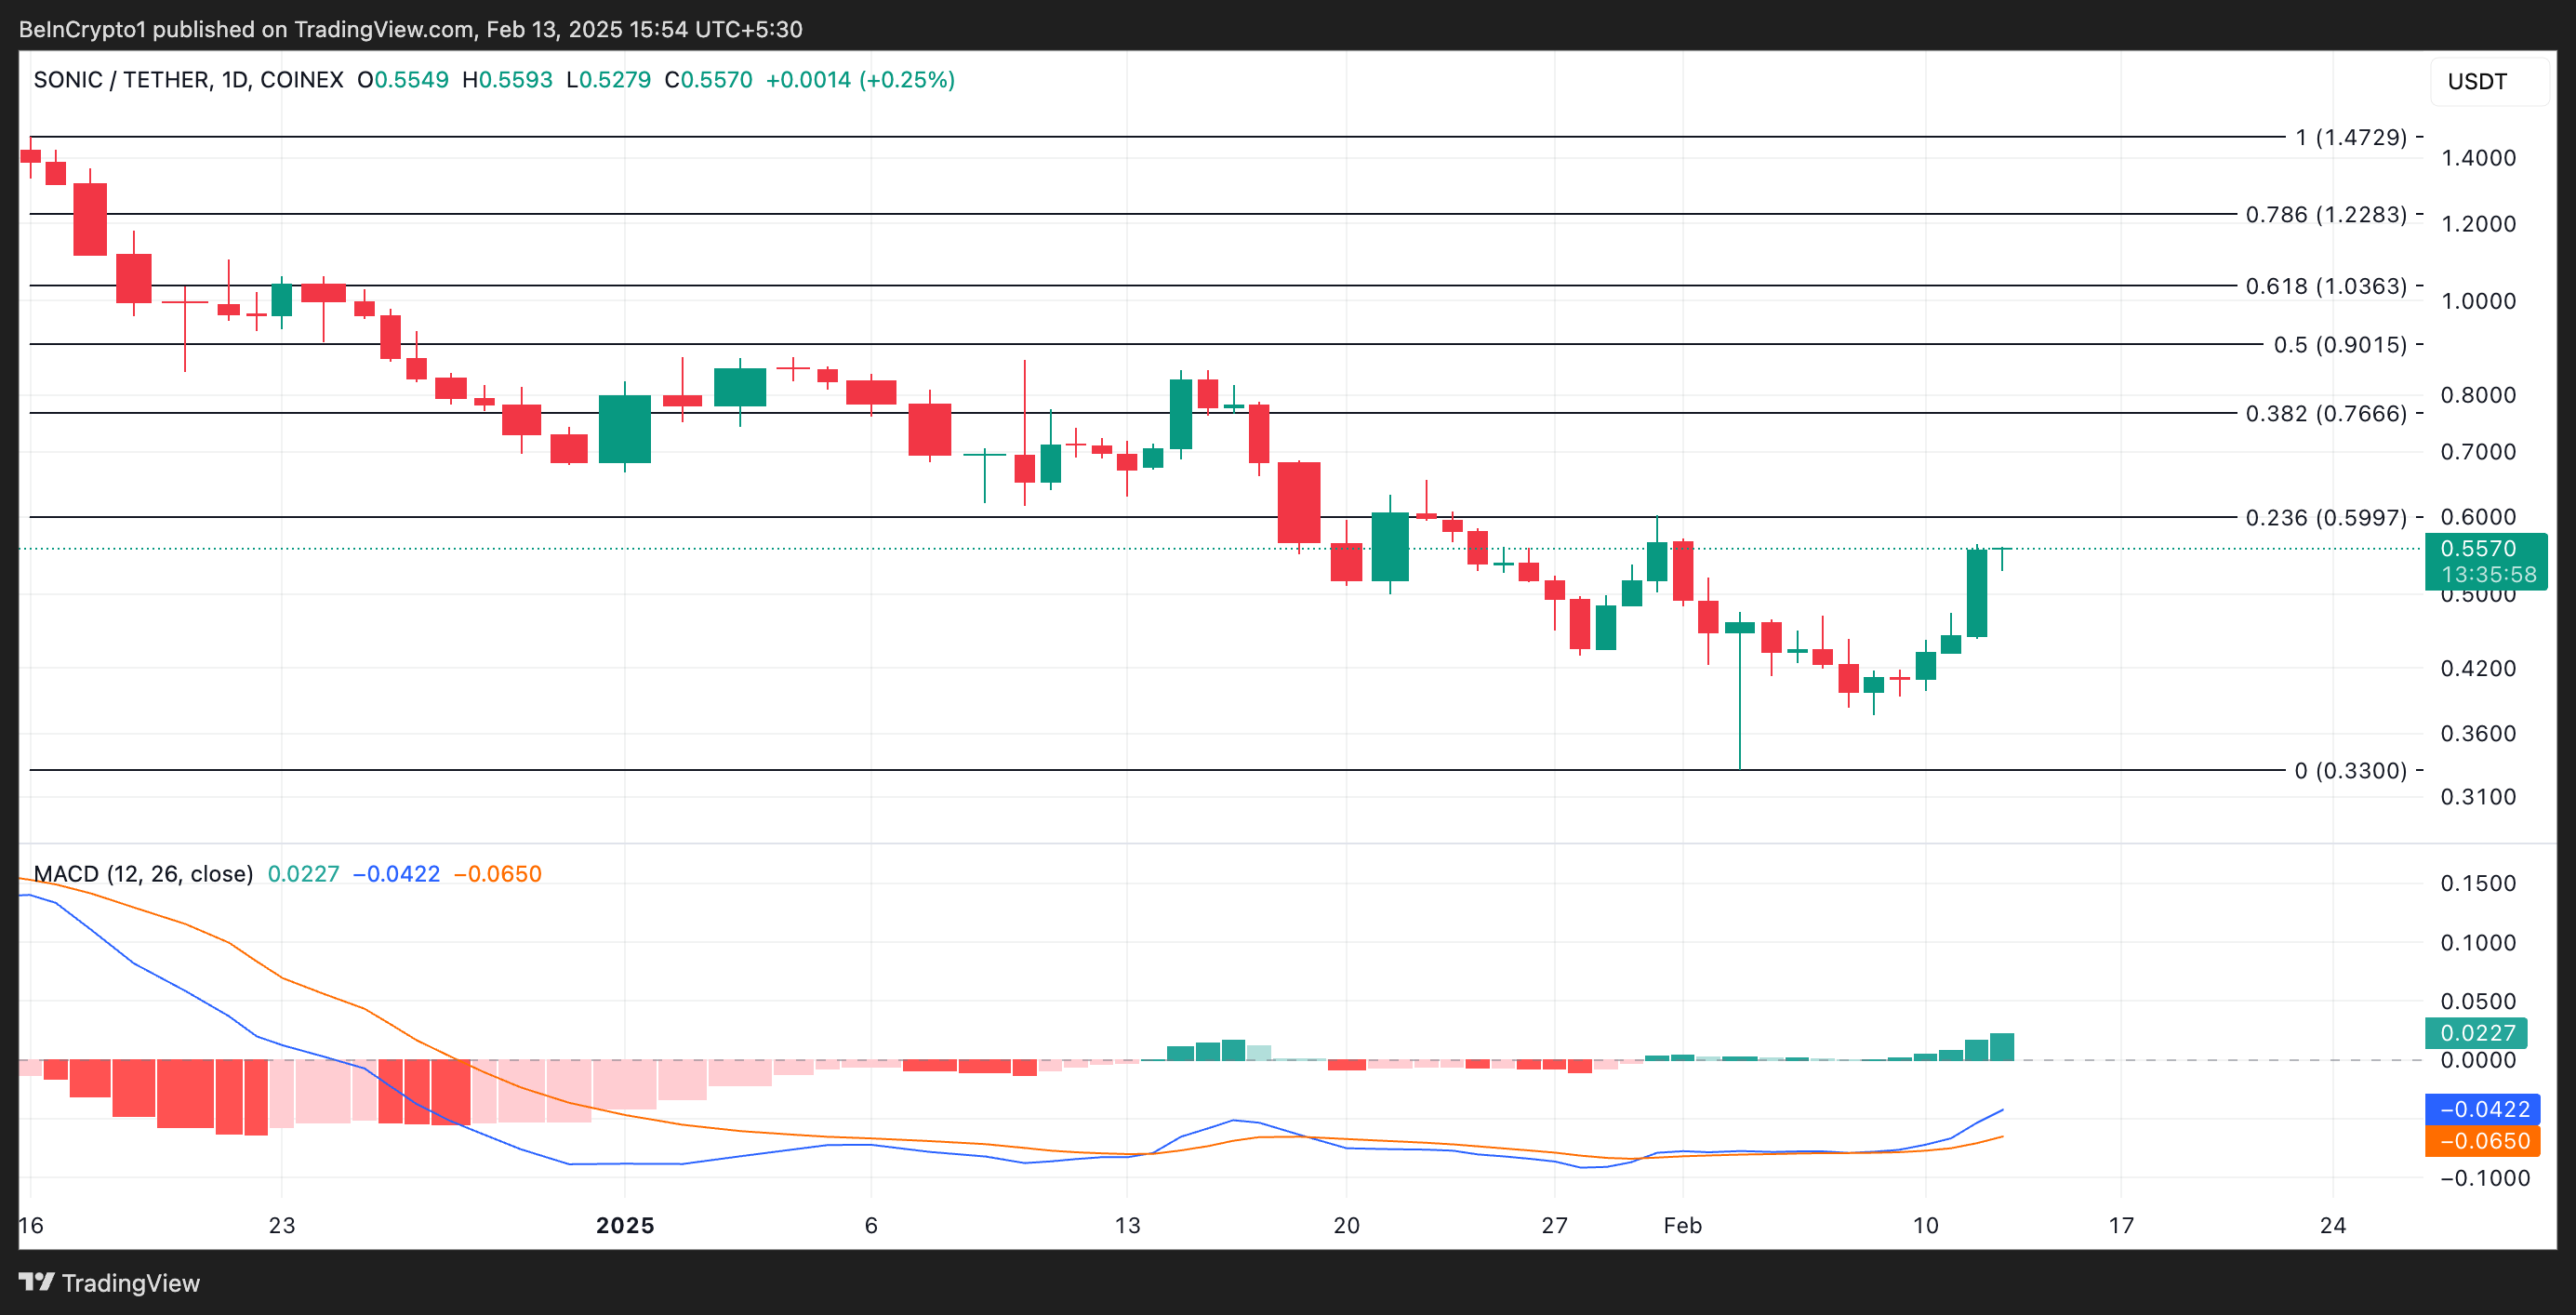
Conversely, a negative shift in market trends could cause S’ price to fall to $0.33.

Log in to Reply
Log in to comment your thoughtsComments
Related Articles