Bitcoin Flatlines—But Analysts Spot Path to $300K: The Ticking Clock

Bitcoin’s price action has gone stale—like week-old coffee in a Wall Street breakroom. Yet chart obsessives see fractal patterns hinting at a moonshot to $300,000. The trigger? A looming supply squeeze as institutional ETFs hoover up coins faster than miners can mint them.
Timing the breakout: Historical halving cycles suggest late 2025 for the fireworks. Of course, this assumes crypto’s usual cocktail of irrational exuberance and hedge fund FOMO—because nothing fuels a bubble like bored money chasing the last pump.
Bitcoin price technical analysis
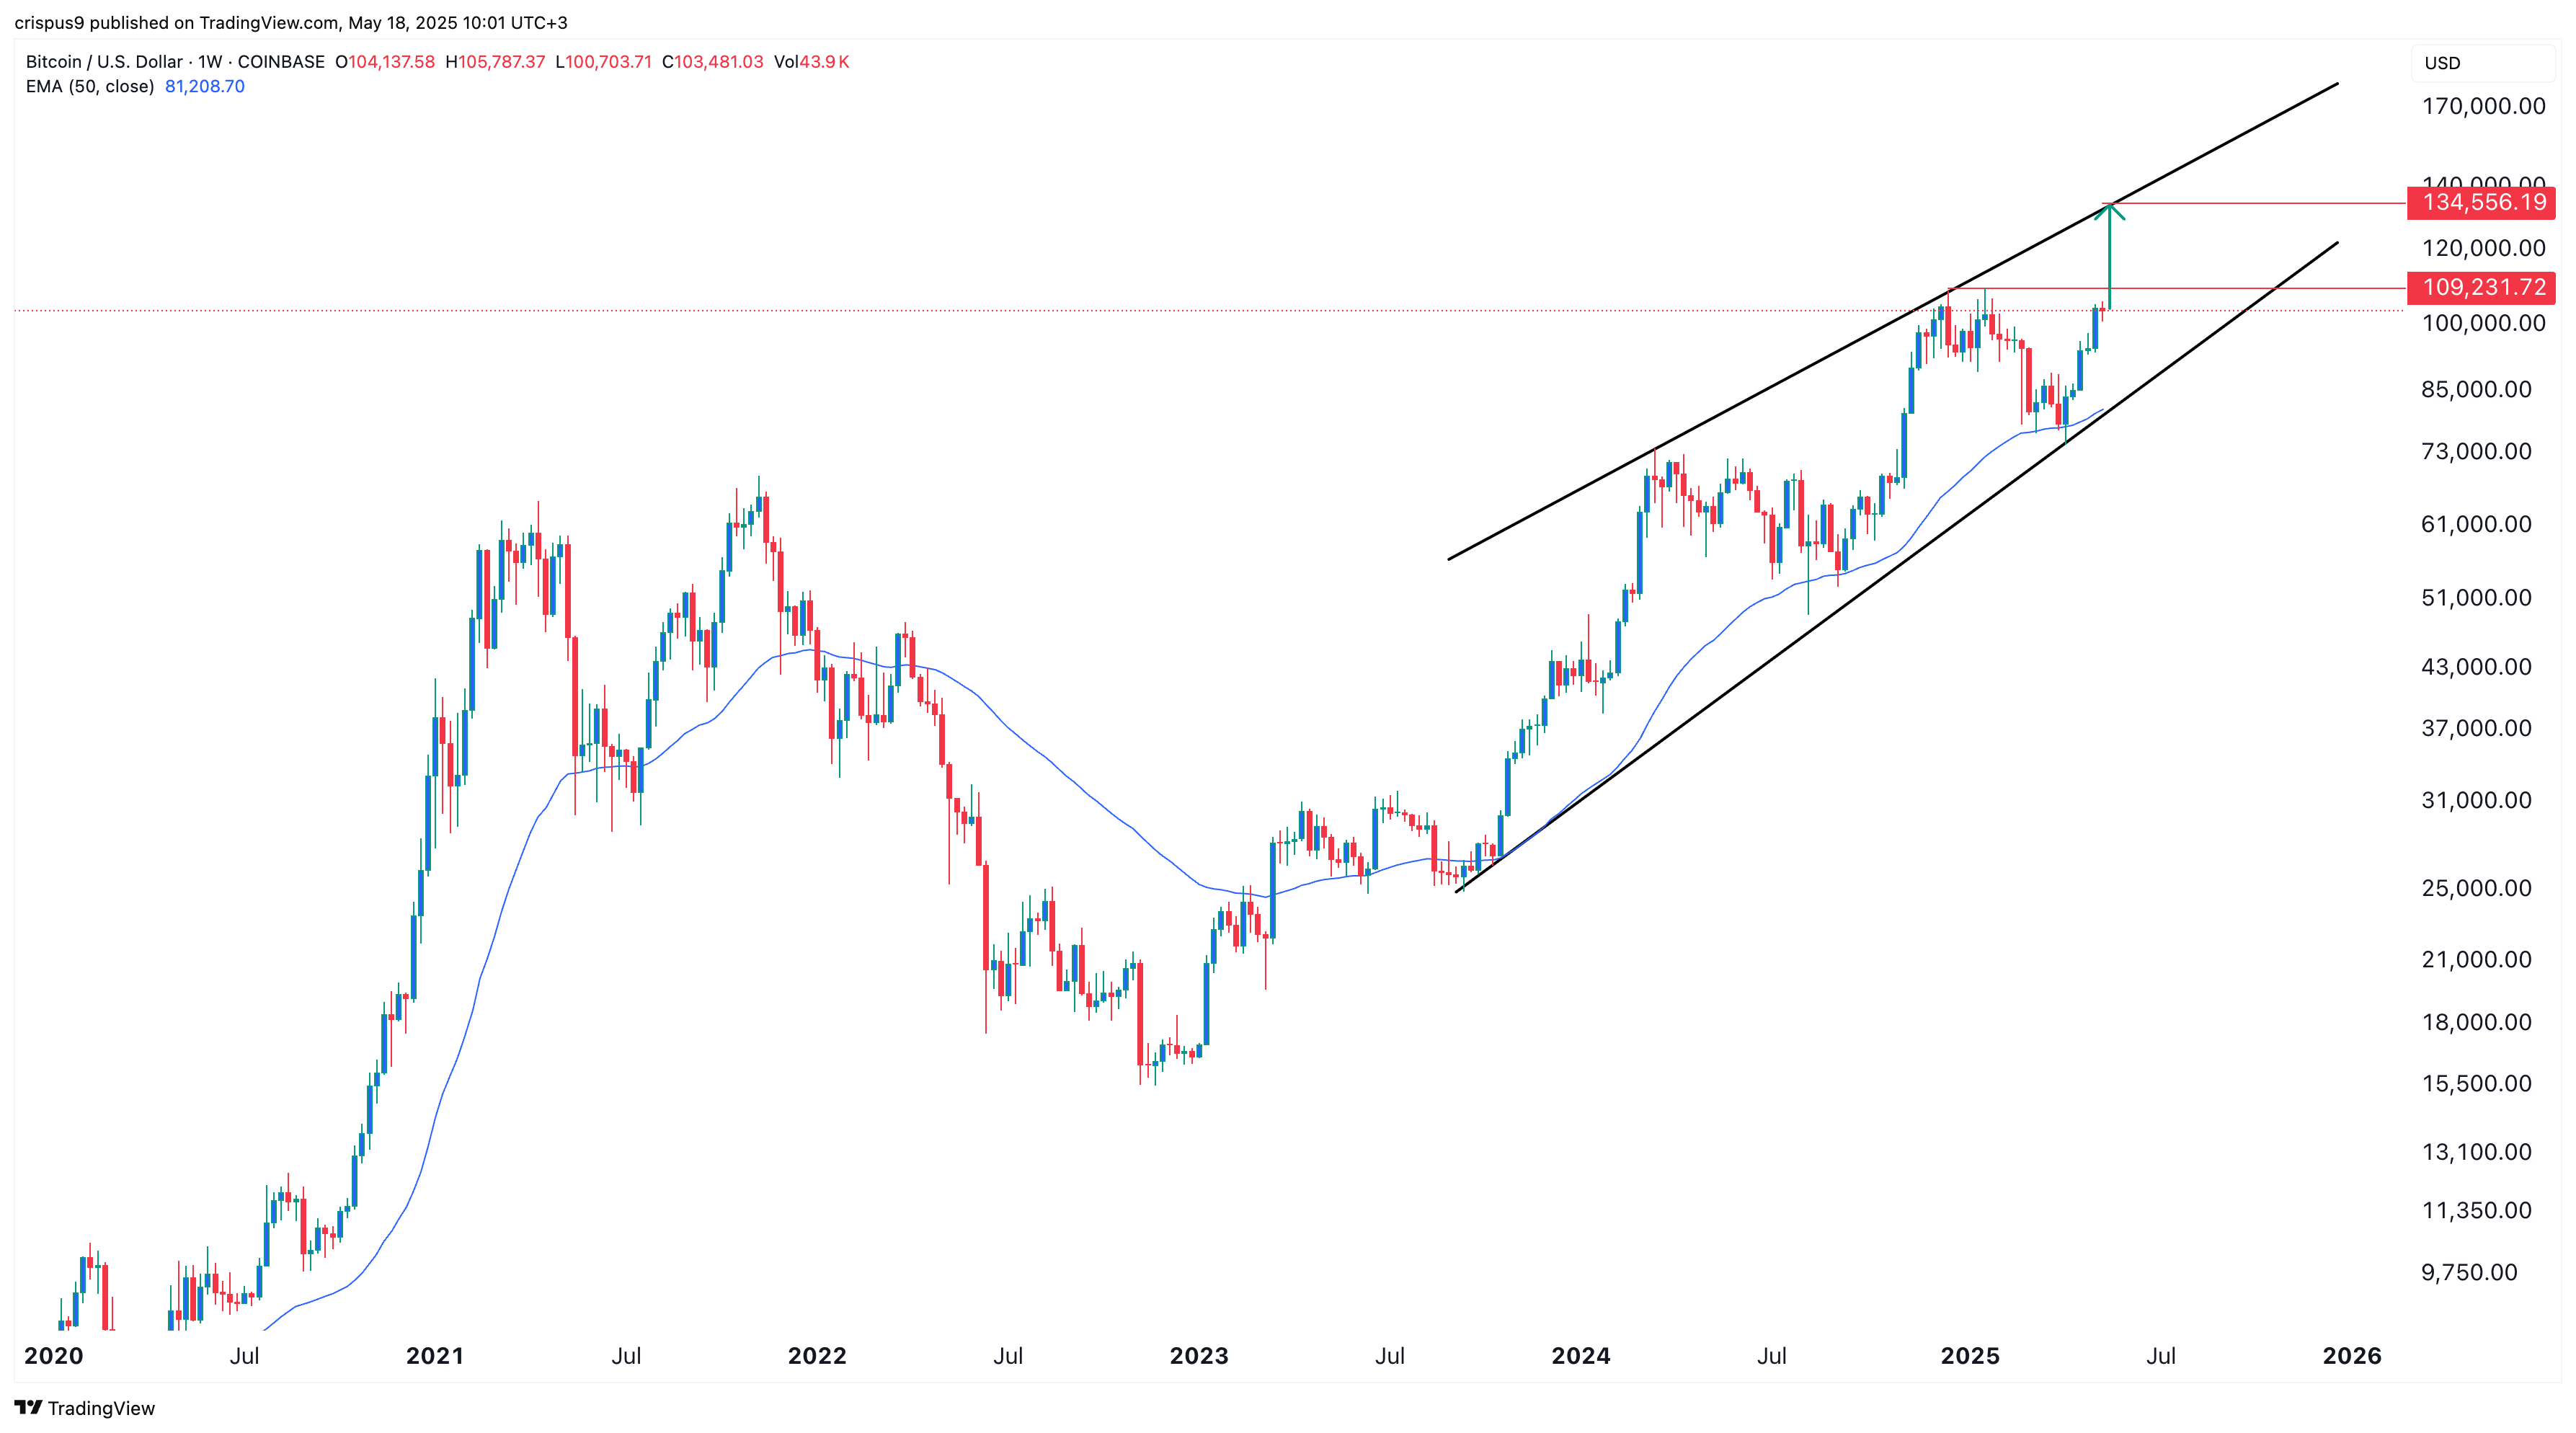
The weekly chart shows that Bitcoin’s price has been in a strong uptrend in the past few months and is now nearing the key resistance level at $109,230, its all-time high.
Since October 2023, the 50-week Exponential Moving Average has supported Bitcoin, which has also formed an ascending channel.
Therefore, more gains will be confirmed if it moves above $109,230, as doing that will invalidate the double-top pattern whose neckline is at the 50-week moving average at $81,210. Such a MOVE will point to more gains, potentially to the upper side of the channel at $134,556.

Log in to Reply
Log in to comment your thoughtsComments
Related Articles
|Square
Get the BTCC app to start your crypto journey
Get started today Scan to join our 100M+ users