HBAR at Critical Juncture: Bulls and Bears Clash at $0.098 Threshold

Hedera's native token teeters on the edge as market forces collide.
The $0.098 level emerges as the crypto equivalent of a high-stakes poker hand—fold now or double down before the flop.
Technical indicators scream 'caution' while degenerate gamblers whisper 'yolo'—because nothing fuels crypto rallies like contrarian despair.
Watch this space: HBAR's next move could either mint new bagholders or reward diamond hands. Just remember—institutional 'adoption' usually means they're ready to dump on retail.

- No clear direction is observed as HBAR is currently consolidating around the price of $0.147.
- HBAR price continues trading below the resistance level of $0.163 as it balances close to the support at $0.130 based on Fibonacci levels.
- A combination of tight Bollinger Bands and negative Fibonacci extensions indicates the occurrence of a breakout or fall in price soon.
The latest market statistics on Hedera (HBAR) indicate that the coin is being traded with a certain amount of caution because it is close to the value of $0.147. Analysts following the daily price chart pointed out that the token cannot sustain the price above major technical indicators.
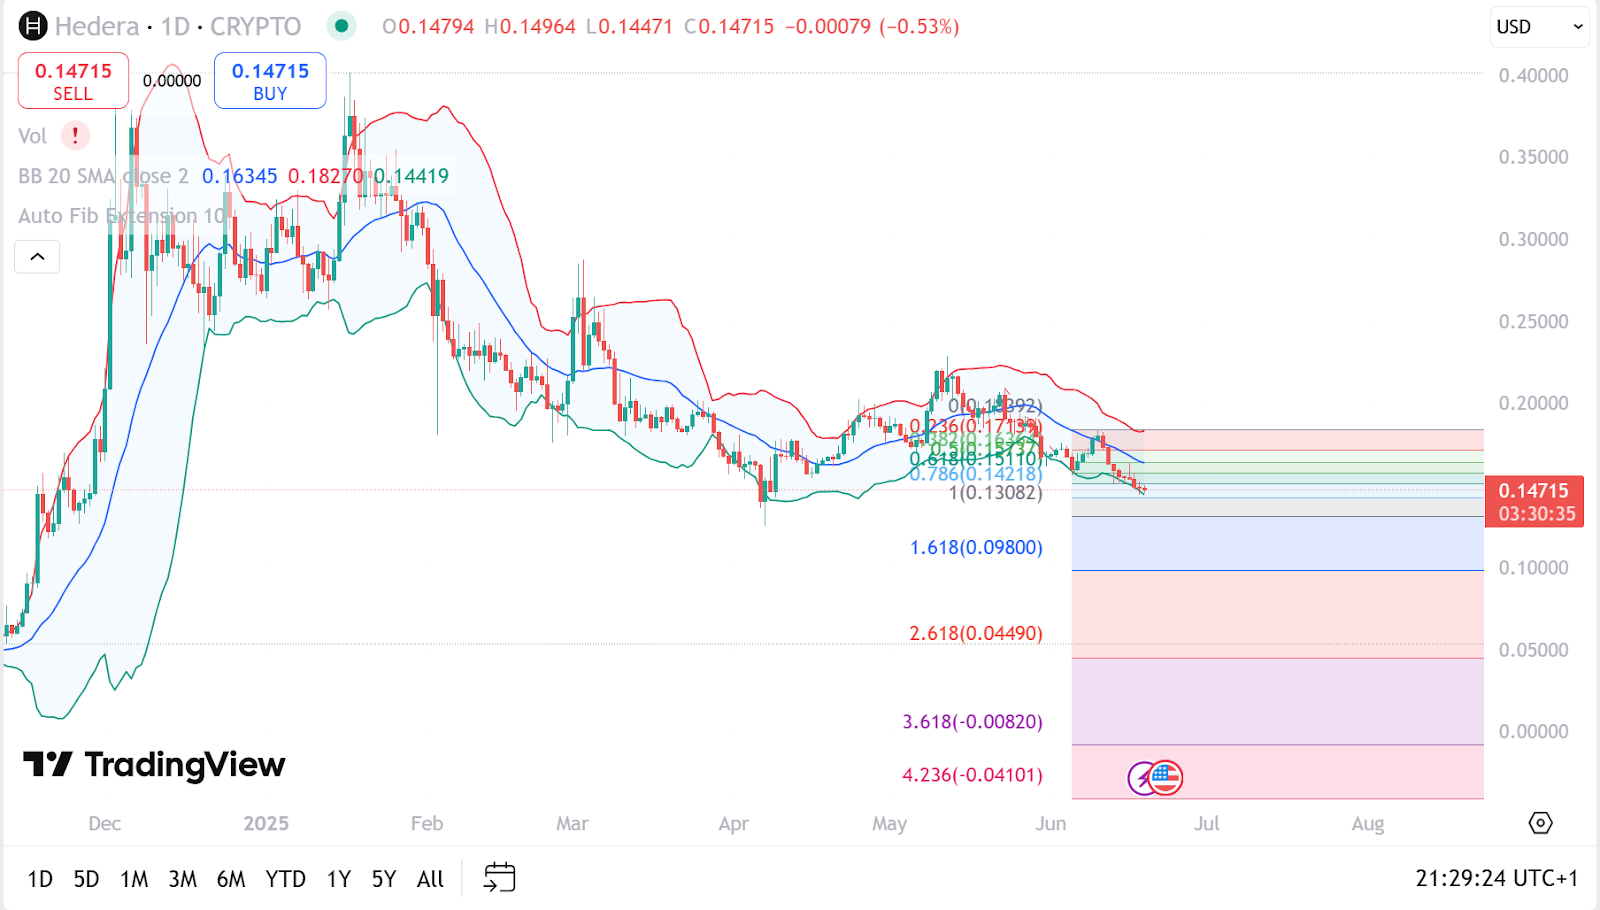
Source: TradingView
By applying the top indicators such as Bollinger Bands and Fibonacci levels, they described that HBAR is at the moment trapped in a very close range, which might mean that there is going to be little volatility and the possibility of a break or fall out of the range in the NEAR future.
HBAR Stalls at $0.163 as Traders Wait for a Breakout
The Bollinger Bands, which indicate volatility in prices and possible support/resistance areas, are narrowing. This is a sign that the market is waiting to break in a certain direction.
The price is already close to the lower band, which in many cases presupposes the oversold conditions. Nonetheless, the middle band is serving as a resistance at approximately $0.163, and so far it seems as though price has been unable to lift itself beyond the region.
Analysts Warn of Sharp Drop if HBAR Breaks Below $0.130 Fib Support
From a Fibonacci retracement and extension standpoint, analysts identified multiple levels that are influencing traders’ behavior. After hitting a recent high, HBAR retraced toward the 0.786 level at around $0.142, which it is now hovering slightly above.
Traders are watching to see if it can bounce back from here, or if it will dip below the $0.130 level marked as the 1.0 Fibonacci support zone.
More caution was expressed around the Fibonacci extension levels. If HBAR breaks down further, the 1.618 extension projects a possible decline to around $0.098.
A deeper drop to the 2.618 level could see HBAR testing $0.044, while the more extreme projections, though less likely without strong bearish news, are mapped out even further, down to -$0.0082 and -$0.041.
Until it clearly breaks above the $0.163 resistance or drops below the $0.130 support, traders and investors may stay on the sidelines.
HBAR Price Analysis: Bearish Pattern Emerges, Resistance Looms at $0.179

Log in to Reply
Log in to comment your thoughtsComments
Related Articles
|Square
Get the BTCC app to start your crypto journey
Get started today Scan to join our 100M+ users