Bitcoin Price Faces Challenges: Will It Break Through and Rise?

Bitcoin price is attempting a recovery wave above the $93,200 zone. BTC is rising and might face resistance NEAR the $97,500 zone.
- Bitcoin started a recovery wave above the $95,000 zone.
- The price is trading above $95,500 and the 100 hourly Simple moving average.
- There is a connecting bullish trend line forming with support at $96,000 on the hourly chart of the BTC/USD pair (data feed from Kraken).
- The pair could start another increase if it stays above the $95,450 support zone.
Bitcoin Price Regains Traction Above Below $95K
Bitcoin price started a short-term recovery wave above the $92,000 zone. BTC was able to climb above the $93,500 and $94,200 levels.
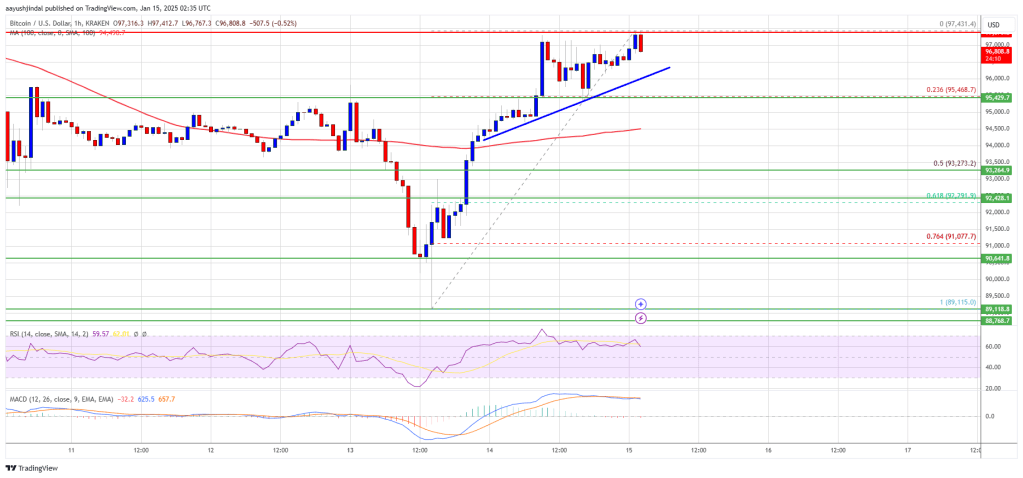
The bulls were able to push the price above the key barrier at $95,800. The price even cleared $97,000. A high was formed at $97,431 and the price is now consolidating gains and is well above the 23.6% Fib retracement level of the upward move from the $89,115 swing low to the $97,431 high.
There is also a connecting bullish trend line forming with support at $96,000 on the hourly chart of the BTC/USD pair. Bitcoin price is now trading above $95,000 and the 100 hourly Simple moving average.
On the upside, immediate resistance is near the $97,450 level. The first key resistance is near the $98,000 level. A clear move above the $98,000 resistance might send the price higher. The next key resistance could be $98,800.
A close above the $98,800 resistance might send the price further higher. In the stated case, the price could rise and test the $100,000 resistance level. Any more gains might send the price toward the $102,500 level.
Another Drop In BTC?
If Bitcoin fails to rise above the $98,800 resistance zone, it could start a fresh decline. Immediate support on the downside is near the $96,000 level and the trend line. The first major support is near the $94,500 level.
The next support is now near the $93,200 zone or the 50% Fib retracement level of the upward move from the $89,115 swing low to the $97,431 high. Any more losses might send the price toward the $92,000 support in the near term.
Technical indicators:
Hourly MACD – The MACD is now gaining pace in the bullish zone.
Hourly RSI (Relative Strength Index) – The RSI for BTC/USD is now above the 50 level.
Major Support Levels – $96,000, followed by $94,500.
Major Resistance Levels – $97,450 and $98,800.

Log in to Reply
Log in to comment your thoughtsComments
Related Articles
|Square
Get the BTCC app to start your crypto journey
Get started today Scan to join our 100M+ users