XRP Pulls Back but Holds Key Support—Bull Case Intact Despite Market Jitters

XRP’s recent dip shakes out weak hands after a 20% rally—classic crypto volatility doing its thing. The token now tests critical trendline support while traders watch for the next leg up.
Technical outlook: The daily chart still paints a bullish picture. Higher lows since March and a golden cross in April suggest this retracement is just pit-stop consolidation. RSI cooling from overbought territory? Healthy.
Wall Street analysts (busy downgrading their fifth coffee order of the morning) whisper about ’macro headwinds.’ Meanwhile, XRP’s on-chain metrics show accumulation at current levels—retail and whales alike stacking before the next breakout.
Bottom line: Until key support at $0.55 cracks, this remains a buy-the-dip market. Just don’t expect your broker to understand why.
XRP Price Dips To Support
XRP price remained supported above the $2.250 level and started a fresh upward wave, like Bitcoin and Ethereum. The price was able to surpass the $2.350 and $2.40 levels.
The bulls pushed the price above the $2.50 resistance zone to set the pace for more gains. Finally, it tested the $2.650 zone. A high was formed at $2.6560 before there was a pullback. The price dipped below $2.50 and the 50% Fib retracement level of the upward MOVE from the $2.3310 swing low to the $2.6560 high.
However, the bulls are active above $2.40. The price is now trading above $2.420 and the 100-hourly Simple Moving Average. There is also a key bullish trend line forming with support at $2.4350 on the hourly chart of the XRP/USD pair.
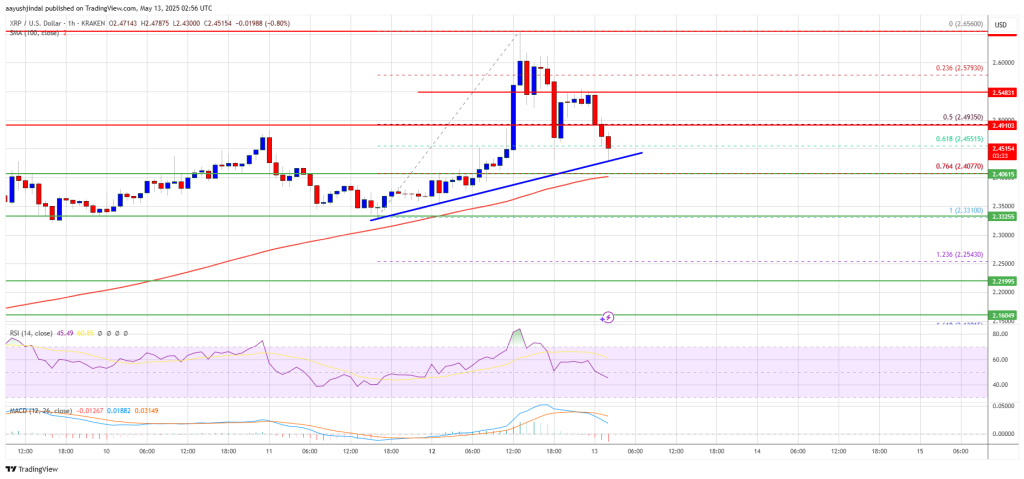
On the upside, the price might face resistance NEAR the $2.4950 level. The first major resistance is near the $2.550 level. The next resistance is $2.600. A clear move above the $2.60 resistance might send the price toward the $2.650 resistance. Any more gains might send the price toward the $2.720 resistance or even $2.7450 in the near term. The next major hurdle for the bulls might be $2.80.
Another Decline?
If XRP fails to clear the $2.550 resistance zone, it could start another decline. Initial support on the downside is near the $2.4350 level and the trend line. The next major support is near the $2.40 level.
If there is a downside break and a close below the $2.40 level, the price might continue to decline toward the $2.350 support. The next major support sits near the $2.320 zone.
Technical Indicators
Hourly MACD – The MACD for XRP/USD is now losing pace in the bullish zone.
Hourly RSI (Relative Strength Index) – The RSI for XRP/USD is now below the 50 level.
Major Support Levels – $2.4350 and $2.40.
Major Resistance Levels – $2.50 and $2.550.

Log in to Reply
Log in to comment your thoughtsComments
Related Articles
|Square
Get the BTCC app to start your crypto journey
Get started today Scan to join our 100M+ users