Solana Under Pressure: Technical Analysis and Key Levels to Watch in October 2025

- Why Is Solana Facing a Correction?
- Key Technical Levels for SOL
- Derivatives Market: What’s the Smart Money Doing?
- Price Forecasts: Bullish vs. Bearish Scenarios
- Conclusion: A Pivotal Moment for SOL
- Solana (SOL) Technical Analysis: Your Questions Answered
Solana (SOL) is navigating a critical correction phase after breaking below a key support level, mirroring Bitcoin's broader market pullback. This analysis dives into SOL's technical outlook, derivative market trends, and pivotal price levels that could dictate its next move. With spot volumes surging 47% to $14.8 billion, the market shows heightened activity amid the downturn. Key supports at $170 and resistances at $237–$253 will determine whether SOL rebounds or extends losses toward $126. Derivative data reveals speculative unwinding and seller dominance, adding fragility to the short-term structure. Here’s what traders need to know.
Why Is Solana Facing a Correction?
Solana’s price hovers around $194, down 14% weekly, as Bitcoin’s retreat triggers a crypto-wide pullback. Despite the dip, spot volumes spiked 47% to $14.8 billion, signaling aggressive trading during the correction. The long-term 200-day SMA still suggests an uptrend, but the 20-day SMA has turned bearish, indicating fading momentum. Oscillators like the RSI confirm weakening buyer pressure, with derivatives markets flashing red flags (more on that later).

Key Technical Levels for SOL
SOL’s immediate resistance zones are $237, $253, and its all-time high of $295—areas where selling pressure could intensify. On the flip side, critical supports lie at $170, $156, and $126, which might attract accumulation if tested. The daily close below $190 confirms short-term weakness, while the monthly pivot at $217 looms overhead. Volume profiles highlight $237 as a high-value zone; a break above or below could ignite volatility.

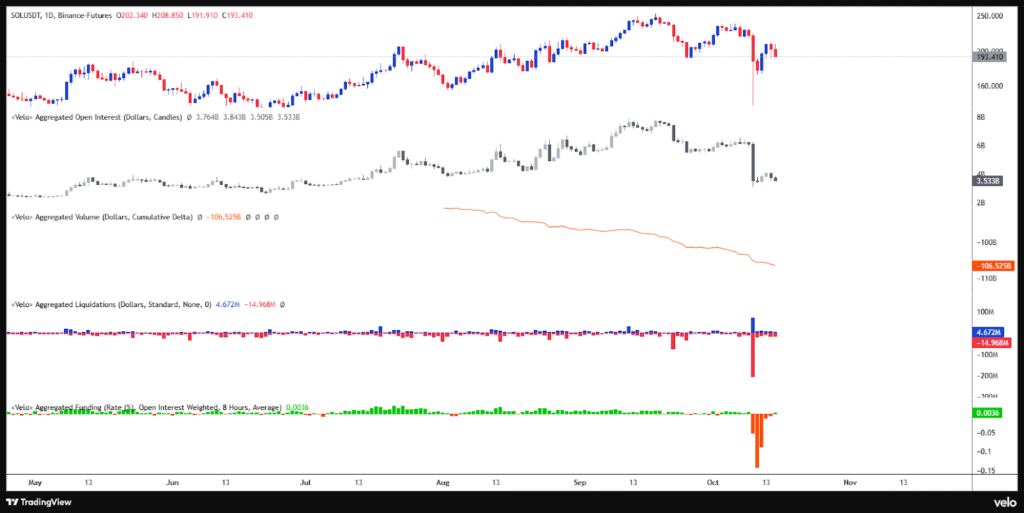
Derivatives Market: What’s the Smart Money Doing?
Futures data paints a cautious picture: Open interest is declining (speculators are exiting), and the CVD indicator shows sellers dominating order flow. Massive long-position liquidations suggest leverage is being flushed out. Funding rates have neutralized, but liquidation clusters at $230–$250 (upside) and $190–$174 (downside) are now make-or-break zones. A squeeze above $250 could revive bulls, while losing $170 may trigger a cascade toward $126.
Price Forecasts: Bullish vs. Bearish Scenarios
Holding $170 could fuel a 52% rally to $210, then $237–$295.A breakdown below $170 opens the door to a 51% drop toward $126 or even $95. The BTCC research team notes that SOL’s medium-term SMA 50 is flatlining, reflecting a standoff between buyers and sellers—typical of consolidation phases.

Conclusion: A Pivotal Moment for SOL
Solana’s structure remains bullish long-term, but short-term fragility demands caution. The $170 level is the linchpin: Hold it, and bulls regain control; lose it, and bears may push for deeper lows. Traders should watch derivative flows and Bitcoin’s moves for clues. As always, this analysis is purely technical—macro factors or regulatory news could shift SOL’s trajectory overnight. This article does not constitute investment advice.
Solana (SOL) Technical Analysis: Your Questions Answered
What’s driving Solana’s current price drop?
SOL’s correction aligns with Bitcoin’s pullback, compounded by overbought conditions and derivative market unwinding. Spot volumes remain high, though, suggesting active trading.
Where are SOL’s make-or-break support levels?
$170 is the key. If it breaks, $156 and $126 become targets. Resistance starts at $237, with $253 as the next hurdle.
How are derivatives traders positioned?
Futures markets show long liquidations and seller dominance, but funding rates are neutral—indicating a balance after recent volatility.
