NEAR Protocol Eyes Breakout as Harmonic Pattern Hints at Rally—Will Traders Bite or Get Rekt Again?

NEAR’s chart flashes a bullish harmonic setup—just as crypto’s retail crowd starts FOMO-ing back in. Because nothing screams ’sustainable rebound’ like pattern-chasing in an asset that’s 60% off its ATH. Watch the $6.50 resistance; break that, and the ’this time it’s different’ brigade gets a fresh narrative.
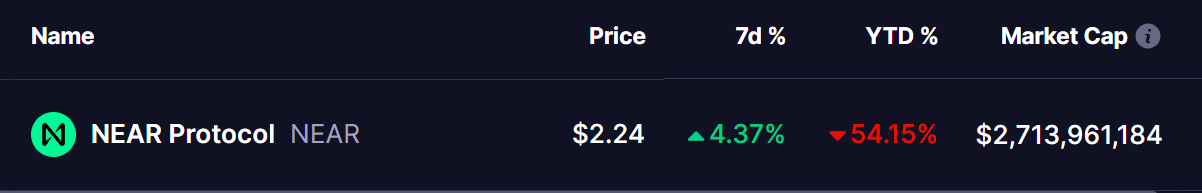 Source: Coinmarketcap
Harmonic Pattern Signals More Upside Move
The 4-hour chart for NEAR reveals the formation of a— a classic harmonic setup that usually predicts a strong bullish rally before facing significant resistance.
The sharp decline began around late March, after NEAR failed to sustain above the $3.09 resistance (marked as point X). From there, the altcoin slid nearly 41%, bottoming out near $1.83 on April 9 (point A).
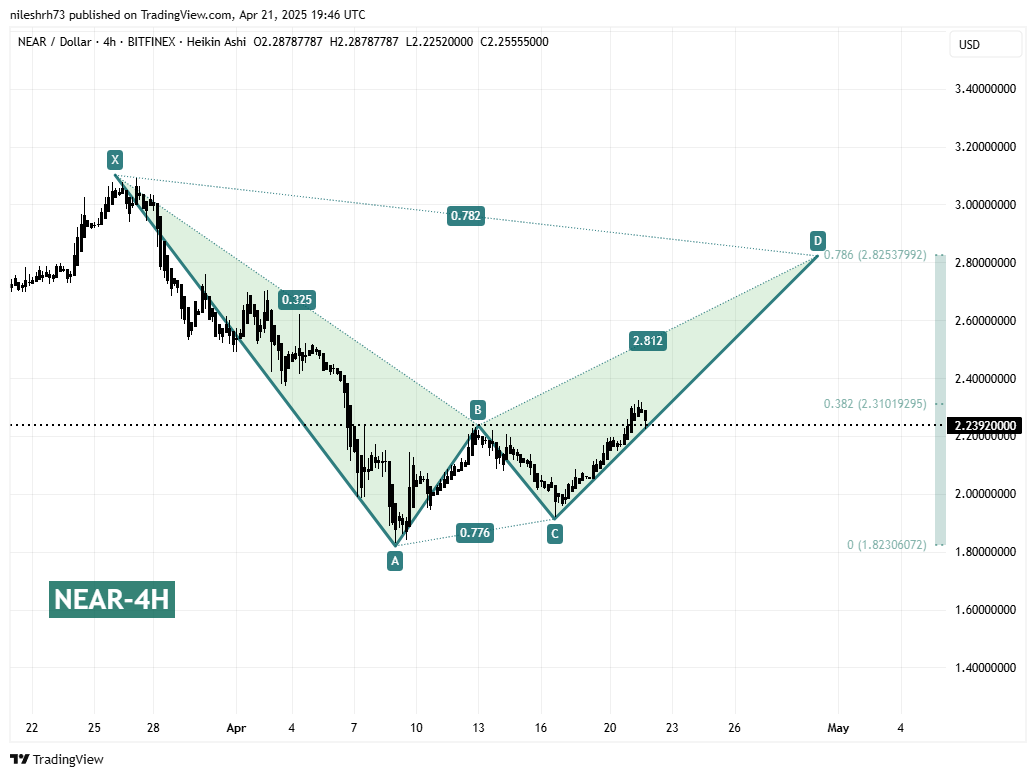
Following this low, NEAR posted a strong rebound from $1.92 (point C), carving out the CD leg of the pattern. At the time of writing, NEAR is trading near $2.24, still moving steadily upward within the structure.
According to the harmonic setup, NEAR has room to climb toward the pattern’s final target (point D) — located near— implying about afrom current levels if the pattern plays out cleanly.
Importantly, this D-point also aligns with theof the major X-A move, adding more confluence to the potential resistance zone.
What’s Next for NEAR?
If buyers maintain momentum, NEAR could push toward the $2.82 level in the coming days, completing the Bearish Gartley structure. This zone would likely act as a strong resistance point, where traders may begin locking in profits or anticipating a corrective pullback.
On the downside, the $2.31 region (corresponding to the 38.2% Fibonacci retracement) is acting as an intermediate resistance. A clean break above this could accelerate the move toward $2.82.
However, traders should remain cautious. Harmonic patterns often result in sharp reversals after the D-point is hit — so while the short-term outlook appears bullish, it’s essential to watch for signs of exhaustion as NEAR approaches its target zone.
This article is for informational purposes only and not financial advice. Always conduct your own research before investing in cryptocurrencies.
