Bitcoin Inflows Now At $732 Billion This Cycle, Report Reveals

Bitcoin's capital floodgates are wide open. A new report confirms a staggering $732 billion has poured into the asset this cycle—a tidal wave of institutional and retail conviction that's rewriting the rules of digital finance.
The New Inflow Reality
Forget the old narratives of speculative retail mania. This $732 billion figure signals a fundamental shift. Capital is moving with purpose, bypassing traditional gatekeepers and flowing directly into a decentralized network. It's not just buying Bitcoin; it's buying into a parallel financial system.
What the Number Means
That $732 billion isn't just a big number—it's a market signal screaming for attention. It represents a massive vote of confidence in Bitcoin's store-of-value proposition, especially as traditional finance grapples with inflationary pressures and geopolitical uncertainty. The inflows cut through the noise, showing a clear preference for hard-capped, verifiable assets over promises printed on paper.
The Institutional Engine
The scale of these inflows points directly to institutional machinery at work. This is the capital of ETFs, corporate treasuries, and asset managers finally making good on their promises. They're not dipping a toe; they're diving in headfirst, bringing a level of stability and demand that previous cycles could only dream of.
A Cynical Take from Finance
Of course, some Wall Street veterans will scoff—calling it a 'glorified digital rock' while their own portfolios are stuffed with derivatives of derivatives. The irony is thick enough to cut with a knife.
The $732 billion inflow marks a point of no return. Bitcoin isn't knocking on finance's door anymore; it's building a bigger, better house right next door. The money has spoken, and its message is deafeningly clear.
Bitcoin Has Seen Historic Growth In Realized Cap This Cycle
On-chain analytics firm Glassnode has released its Q4 2025 Digital Assets Report in collaboration with crypto investment firm Fasanara Digital, shedding light on how the market landscape has developed in the fourth quarter of 2025.
One of the things the report has talked about is the trend in the Realized Cap of Bitcoin. This capitalization model calculates the total value of the cryptocurrency by assuming the the value of each individual token is equal to the price at which it was last transacted on the blockchain.
The last transaction of any token is likely to represent the last time it changed hands, so the price at its time could be considered as its current cost basis. As such, the Realized Cap is a sum of the acquisition values of all coins in circulation. In other words, the model represents the total amount of capital that the investors used to purchase the asset’s supply. Considering this, changes in the indicator naturally correspond to the netflow of capital.
Below is a chart that shows how the bitcoin Realized Cap has fluctuated over the last few years.

As displayed in the graph, the monthly change in the Bitcoin Realized Cap has remained positive over the last couple of years, indicating that the network has been enjoying a sustained expansion in stored capital.
The rate of inflows has varied a lot over the cycle, however, accelerating to high levels during rallies and slowing down during flat or bearish periods. Most recently, the monthly increase in the metric hit a high of $39.8 billion in October, but the bearish momentum since then has meant a cooldown to $15 billion.
Following the continued rise in the Realized Cap, its value has reached a new all-time high (ATH) of $1.1 trillion. The report noted that this marks “a historic milestone that underscores Bitcoin’s continued evolution as a globally held, high-liquidity asset.”
The Realized Cap has clearly witnessed a significant amount of growth this cycle. But how does it stack up against the capital inflows of the past cycles? Here is another chart, this one comparing the cumulative Realized Cap change for each cycle:
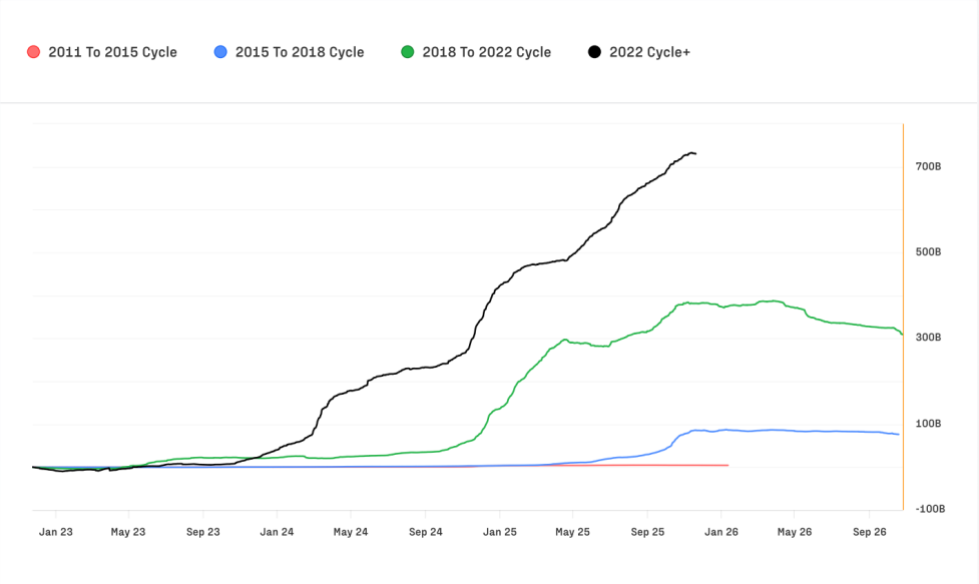
In total, the current cycle has attracted over $732 billion in capital. The last cycle saw $388 billion in inflows, and the two cycles before that about $90 billion combined. Thus, the latest cycle has not only outpaced each of the past cycles, but it has in fact seen a higher Realized Cap increase than all of them combined.
BTC Price
Bitcoin’s latest recovery has so far been holding as its price is trading around $92,800.
