Onyxcoin (XCN) Targets Three-Year Peak as It Leads Market Gains

XCN is now eyeing its three-year high of $0.04, with technical indicators signaling strong upside potential.
Onyxcoin Sees New Gains
Besides the broader market rally, XCN’s price surge is largely fueled by the recent announcement that the Onyx DAO has successfully resolved a longstanding issue with HTX Global and Justin Sun. Trading at $0.03 at press time, XCN’s price has since climbed by 76% as demand strengthens.
Its Relative Strength Index (RSI), assessed on a one-day chart, confirms this growing demand. At press time, the key momentum indicator is in an upward trend at 64.78.
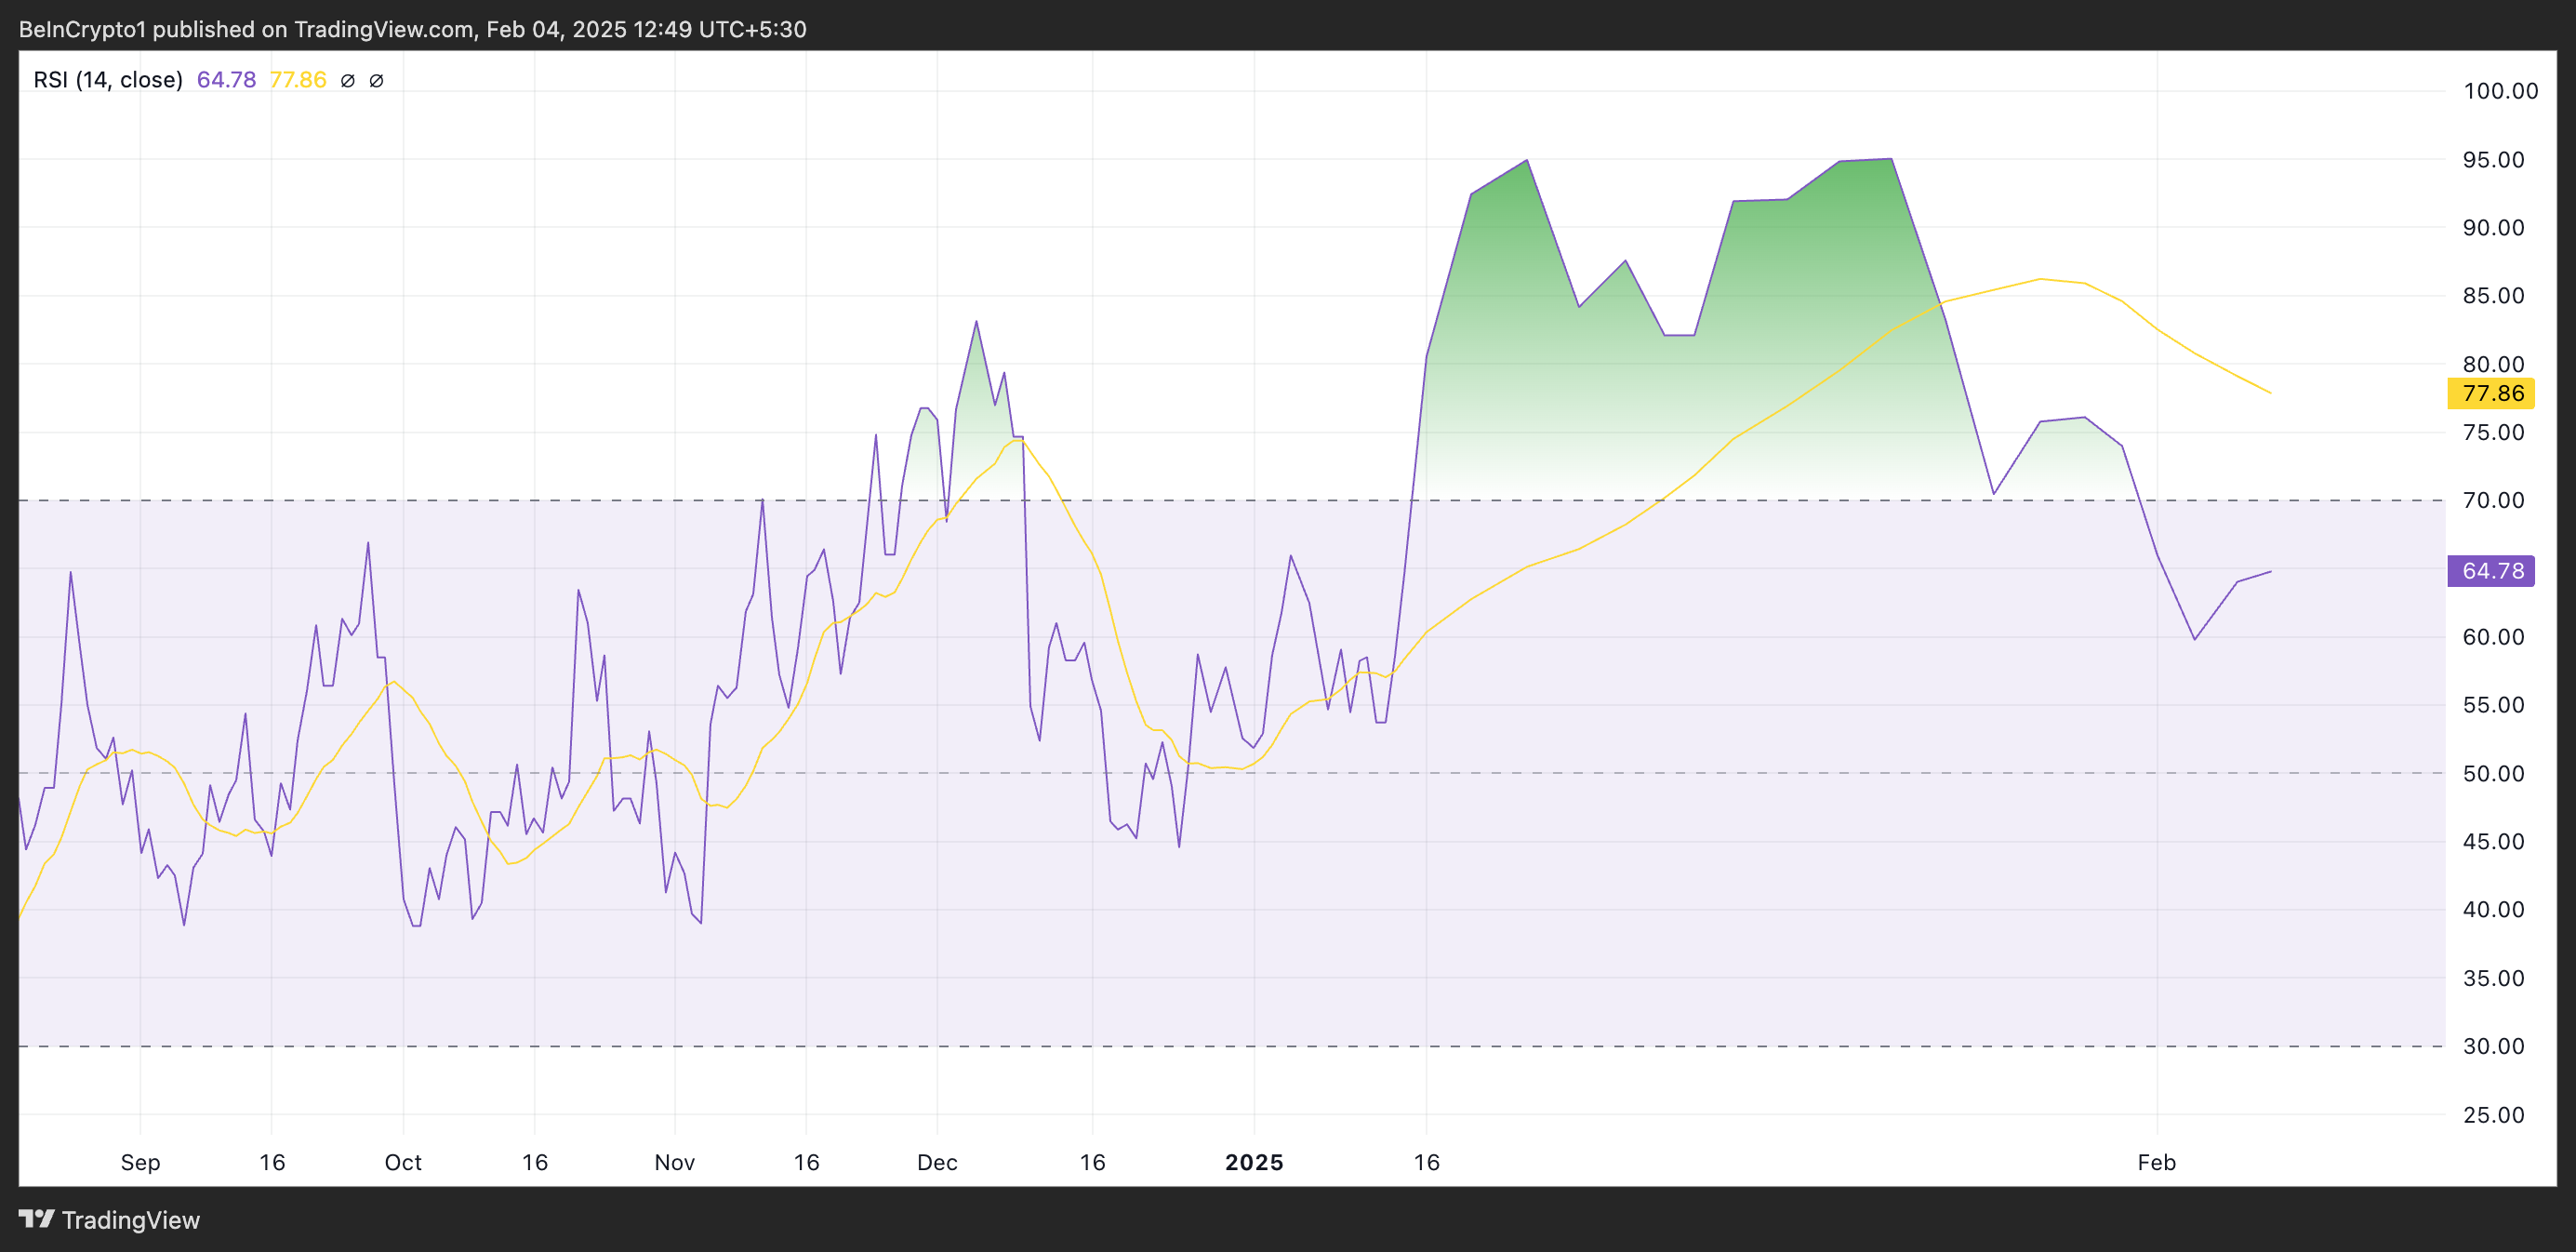
This indicator measures an asset’s overbought and oversold market conditions. It ranges between 0 and 100, with values above 70 indicating that the asset is overbought and due for a correction. Conversely, values below 30 suggest that the asset is oversold and may witness a rebound.
At 64.78, XCN’s RSI suggests that the asset is in a strong bullish phase, with increasing buying pressure. As the RSI continues to rise, XCN’s demand is growing, and the upward momentum may continue unless it approaches overbought levels.
Notably, XCN has recorded spot inflows for the first time since January 27. According to Coinglass, this currently stands at $1.04 million, reflecting the buying activity in the market.
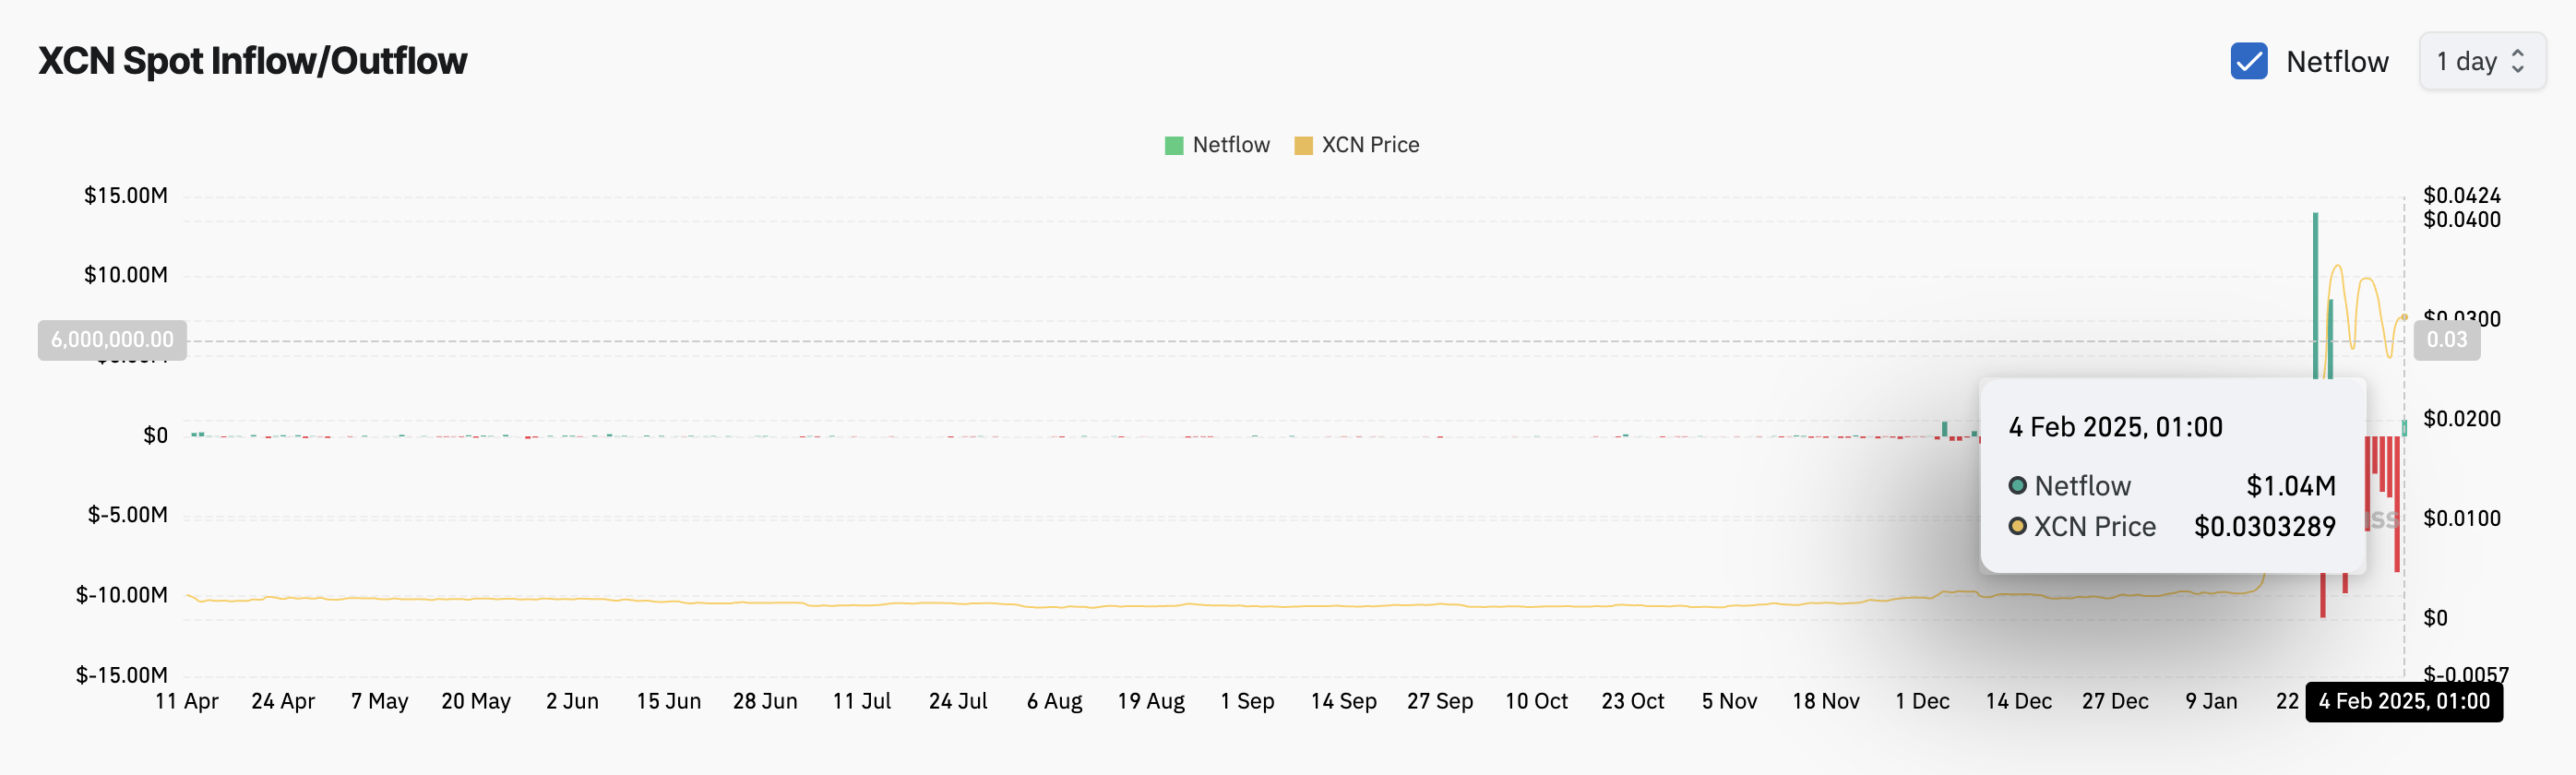
When an asset records spot inflows, more traders buy it directly on exchanges rather than through derivatives, signaling strong demand. This increased buying pressure typically drives prices higher as more investors accumulate the asset.
XCN Price Prediction: Aiming for $0.04 or Facing Reversal?
The daily chart shows XCN trades just below the resistance at $0.038. If buying momentum strengthens, it could break above this price level.
A successful breach of the resistance could propel XCN to $0.049, a three-year high that it recently revisited on January 26.
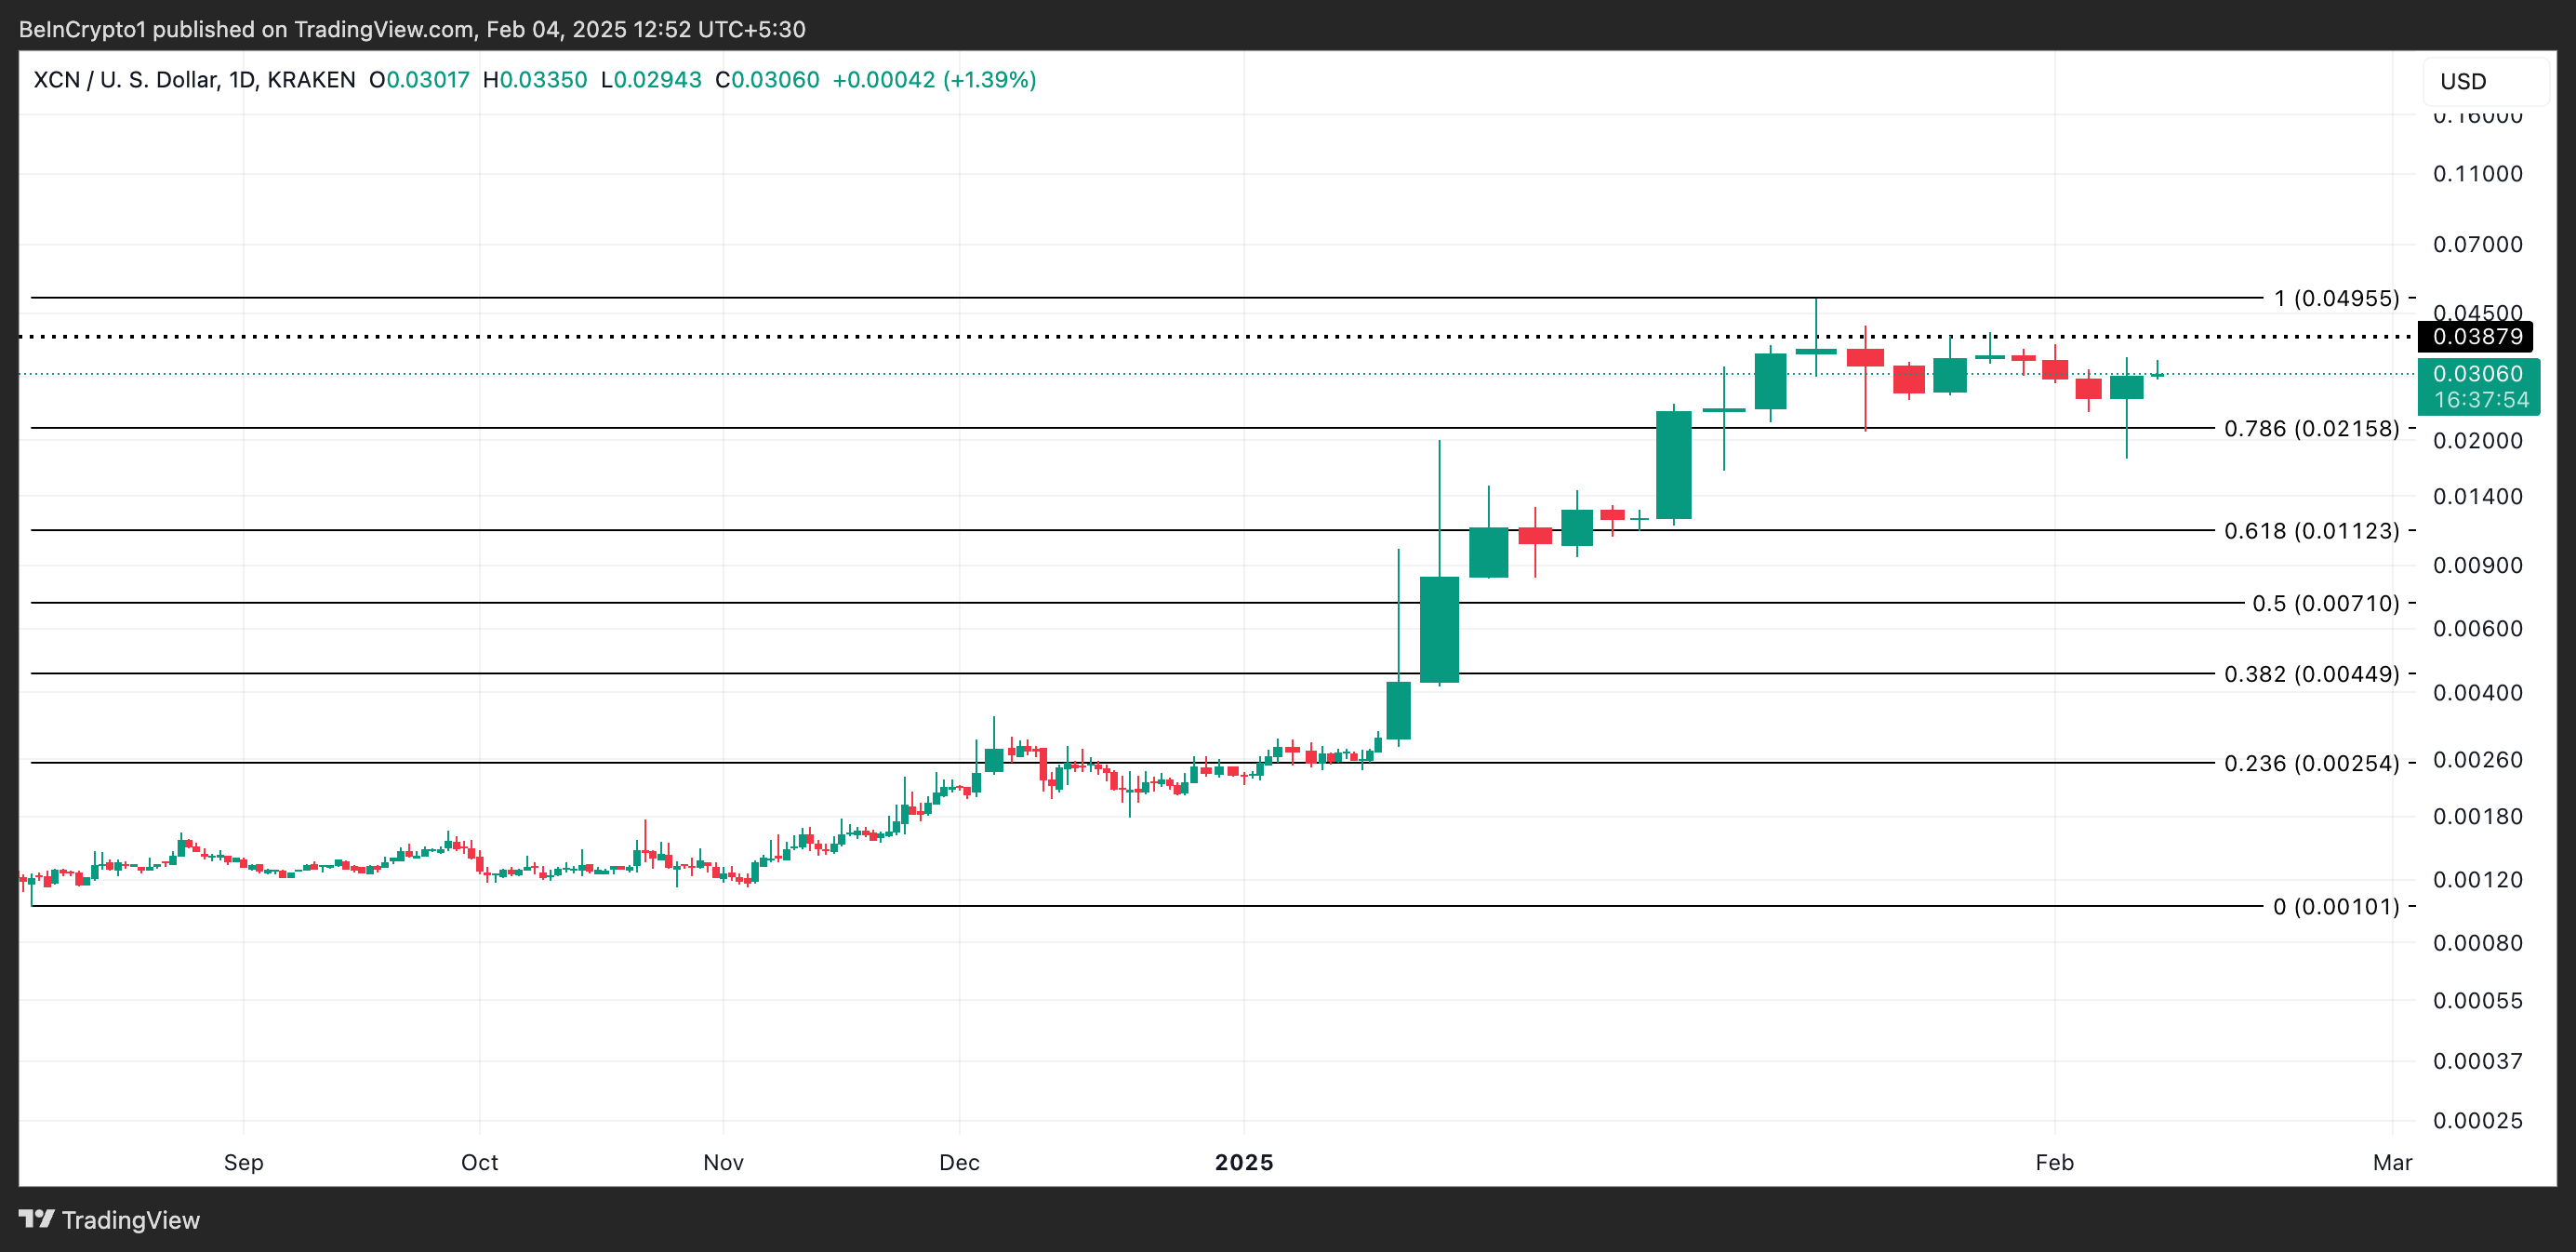
However, if market participants resume profit-taking, this bullish thesis will be invalidated. In that scenario, XCN’s value could drop to $0.021.

Log in to Reply
Log in to comment your thoughtsComments
Related Articles
|Square
Get the BTCC app to start your crypto journey
Get started today Scan to join our 100M+ users