4-Year Pattern Points to Bitcoin Rally – Is It Happening Again?

Despite recent volatility, BTC’s bullish momentum remains strong, and the cryptocurrency appears to be repeating historical patterns observed during prior market cycles.
Bitcoin Is Not In Danger
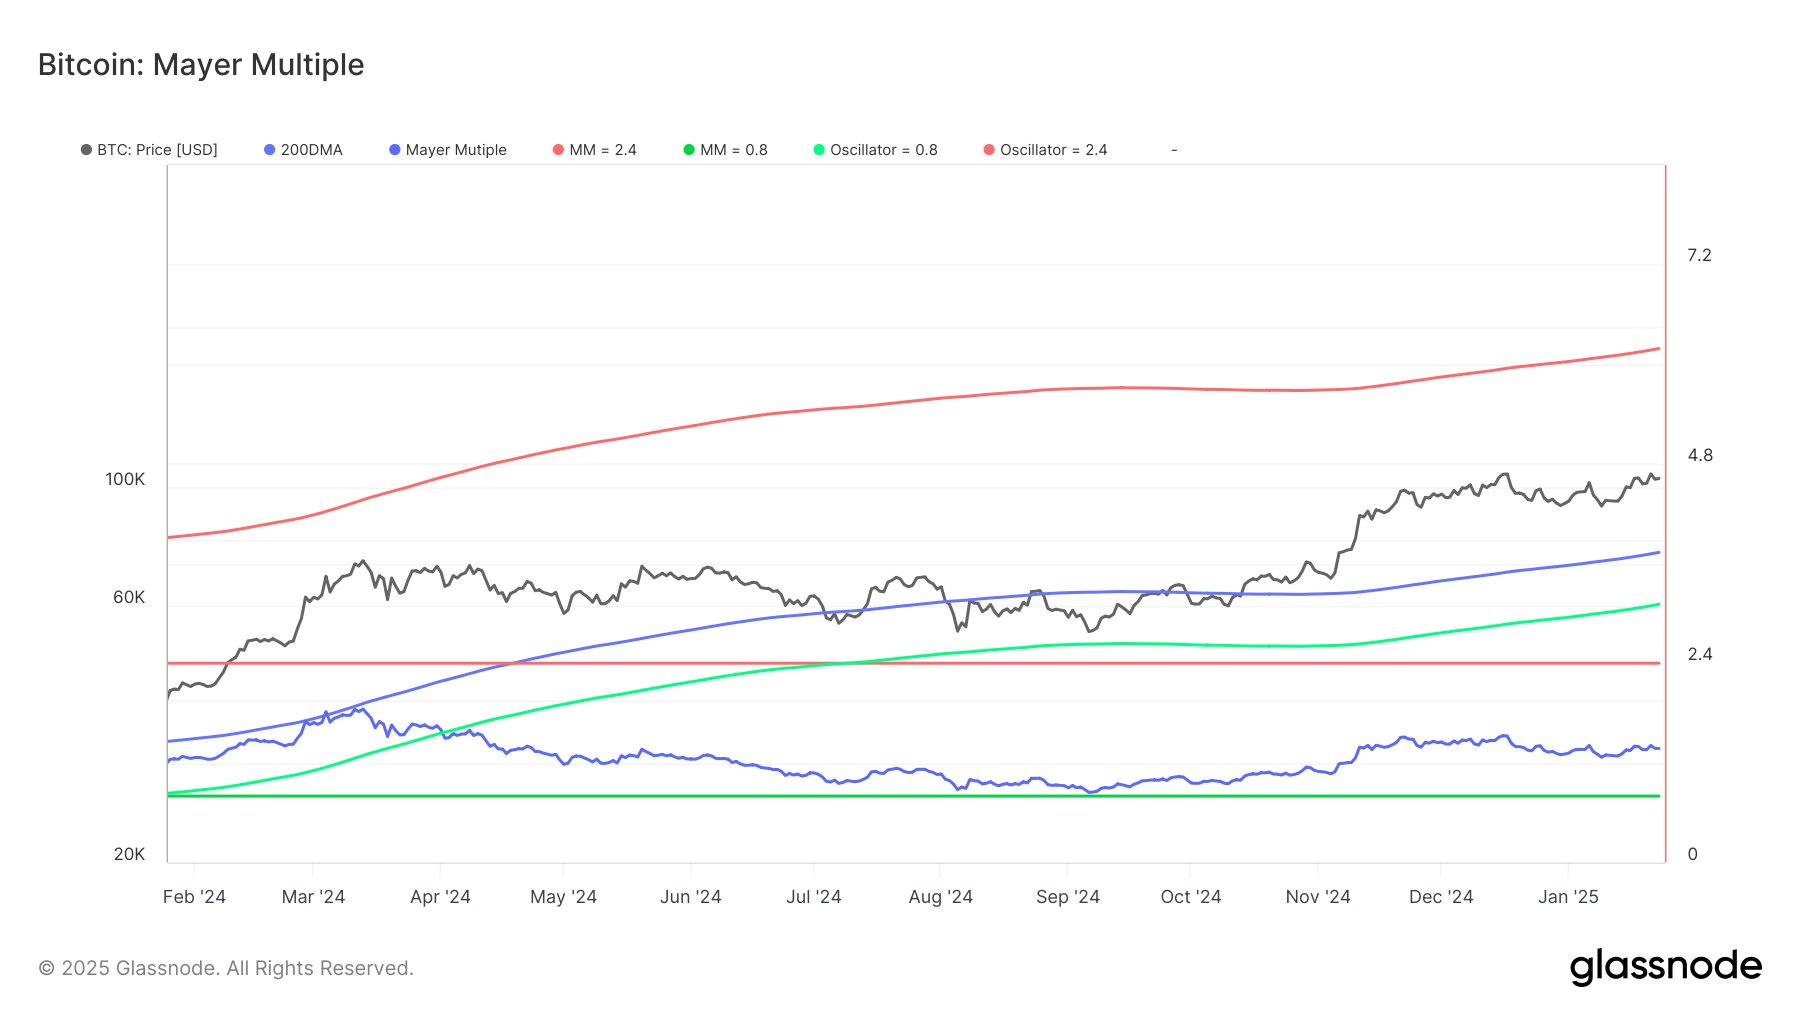
The Mayer Multiple indicator shows Bitcoin is neither overbought nor oversold, currently positioned at a neutral level. This signals that the ongoing bullish momentum could continue, providing room for the price to rise further without facing immediate correction. Such neutrality in market sentiment is a promising sign for Bitcoin enthusiasts.
The indicator’s neutral stance suggests stability, with buyers and sellers maintaining equilibrium. This balance, paired with Bitcoin’s bullish trend, indicates that the cryptocurrency could gather sufficient momentum to breach key resistance levels and potentially target a new ATH in the NEAR term.
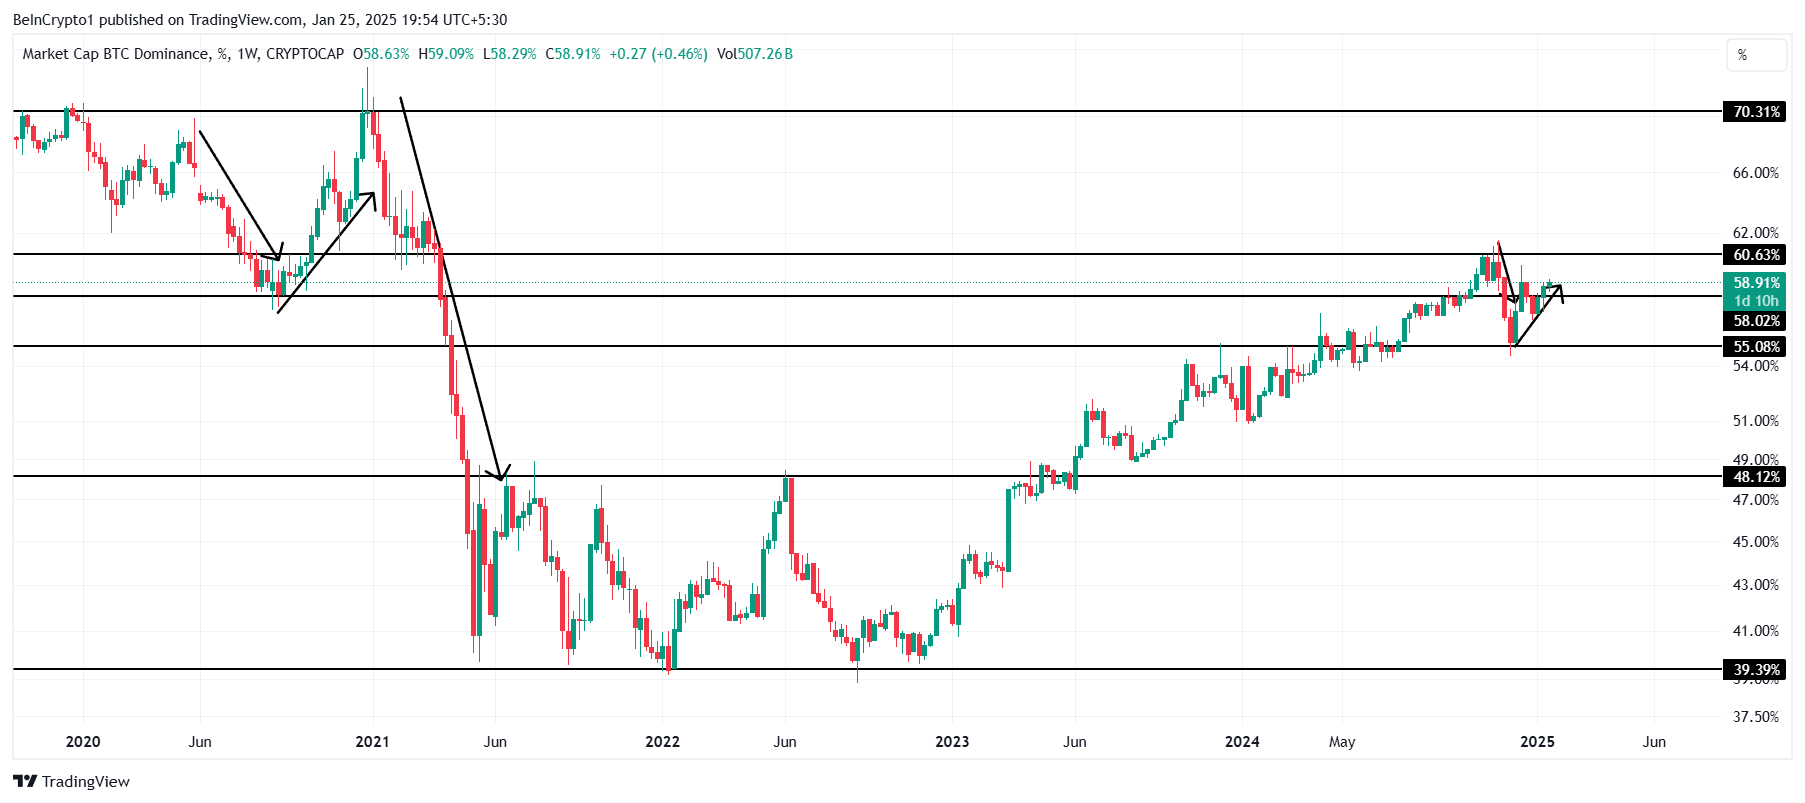
Bitcoin’s dominance in the cryptocurrency market is following a 4-year pattern, providing insights into its macro momentum. After bottoming at 54% in December 2024, Bitcoin dominance has surged past 57% in January 2025. This pattern mirrors the 2020 cycle, where dominance bottomed at 60% in November 2020 and climbed to 69% by January 2021.
The resurgence in Bitcoin’s dominance highlights its strengthening position as the market leader. Similar to the 2020 cycle, this trend indicates a potential rally in Bitcoin’s price. This is because increased dominance typically aligns with a bullish phase for the cryptocurrency.
BTC Price Prediction: Finding A Break
Bitcoin’s price is currently at $104,647, having failed to flip the $106,193 resistance into support. Breaching this level is crucial for Bitcoin to advance beyond $108,400 and post a new ATH, solidifying its upward momentum.
The current ATH stands at $108,341, and Bitcoin’s formation of a double-bottom pattern suggests an 11% rally could follow a breakout. If this plays out, Bitcoin’s price could target $113,428. This would reinforce its bullish trajectory and mark a significant milestone for the crypto king.
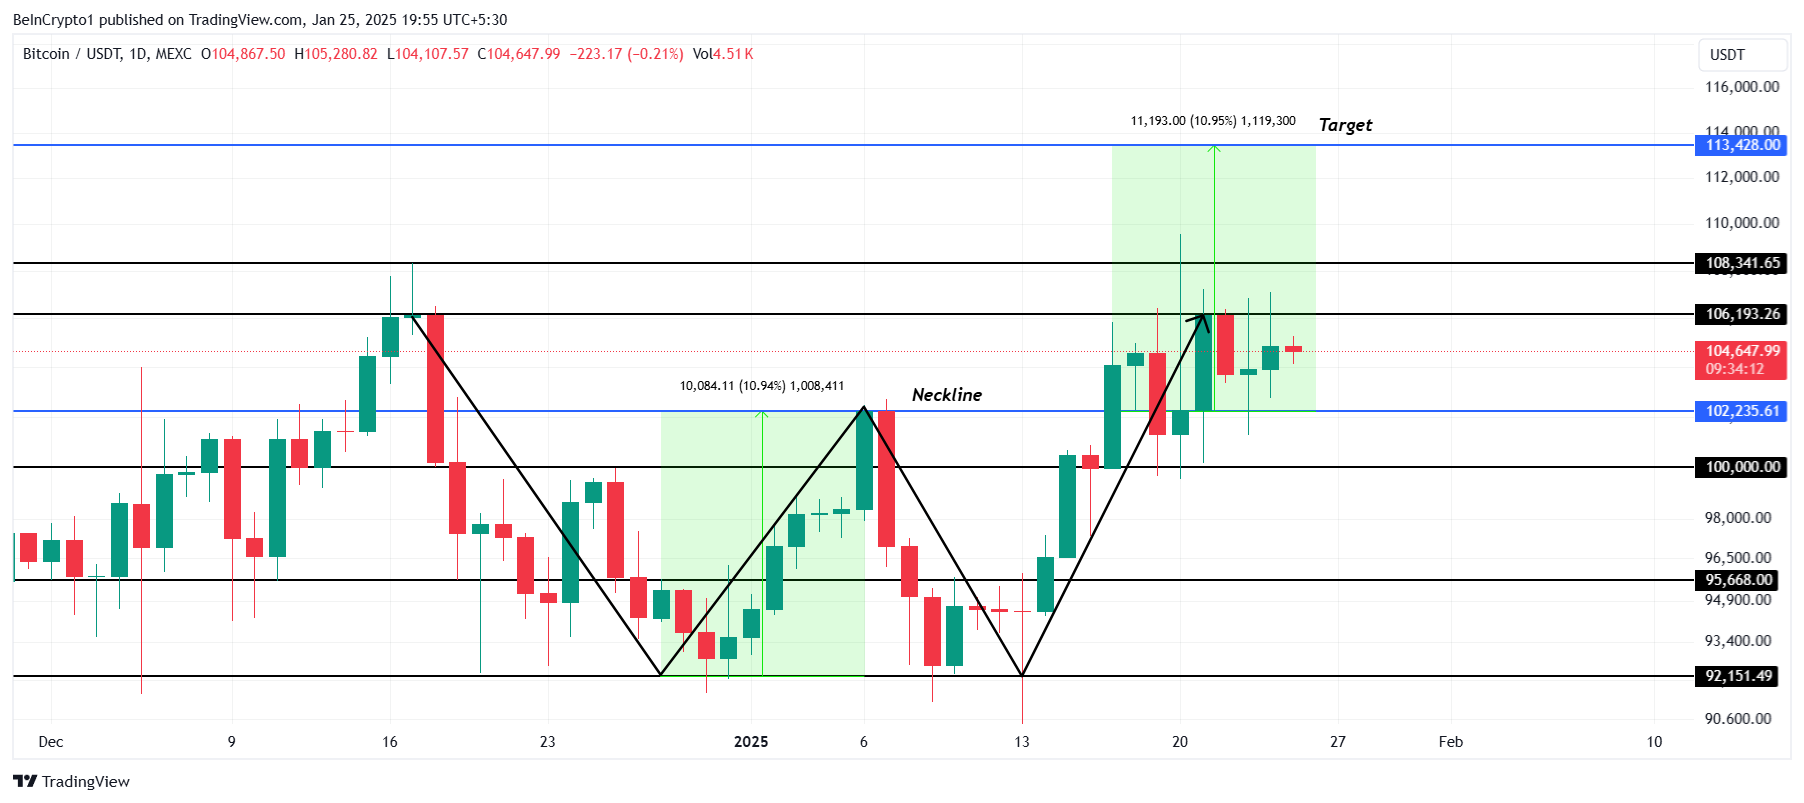
However, failure to breach $106,193 could result in consolidation above $102,235. Losing this support level could trigger a further decline to $100,000, with a potential dip to $95,668. This scenario would challenge Bitcoin’s bullish outlook, emphasizing the importance of maintaining key support levels.

Log in to Reply
Log in to comment your thoughtsComments
Related Articles
|Square
Get the BTCC app to start your crypto journey
Get started today Scan to join our 100M+ users