Bitcoin (BTC) Futures Volume Surges to $82 Billion Amid Rising Short Positions

For some market observers, this resurgence implies a bullish outlook for the cryptocurrency. But Bitcoin traders seem to be choosing the other path.
Bitcoin Rising Liquidity in the Derivatives Market Is Not a Bullish Sign
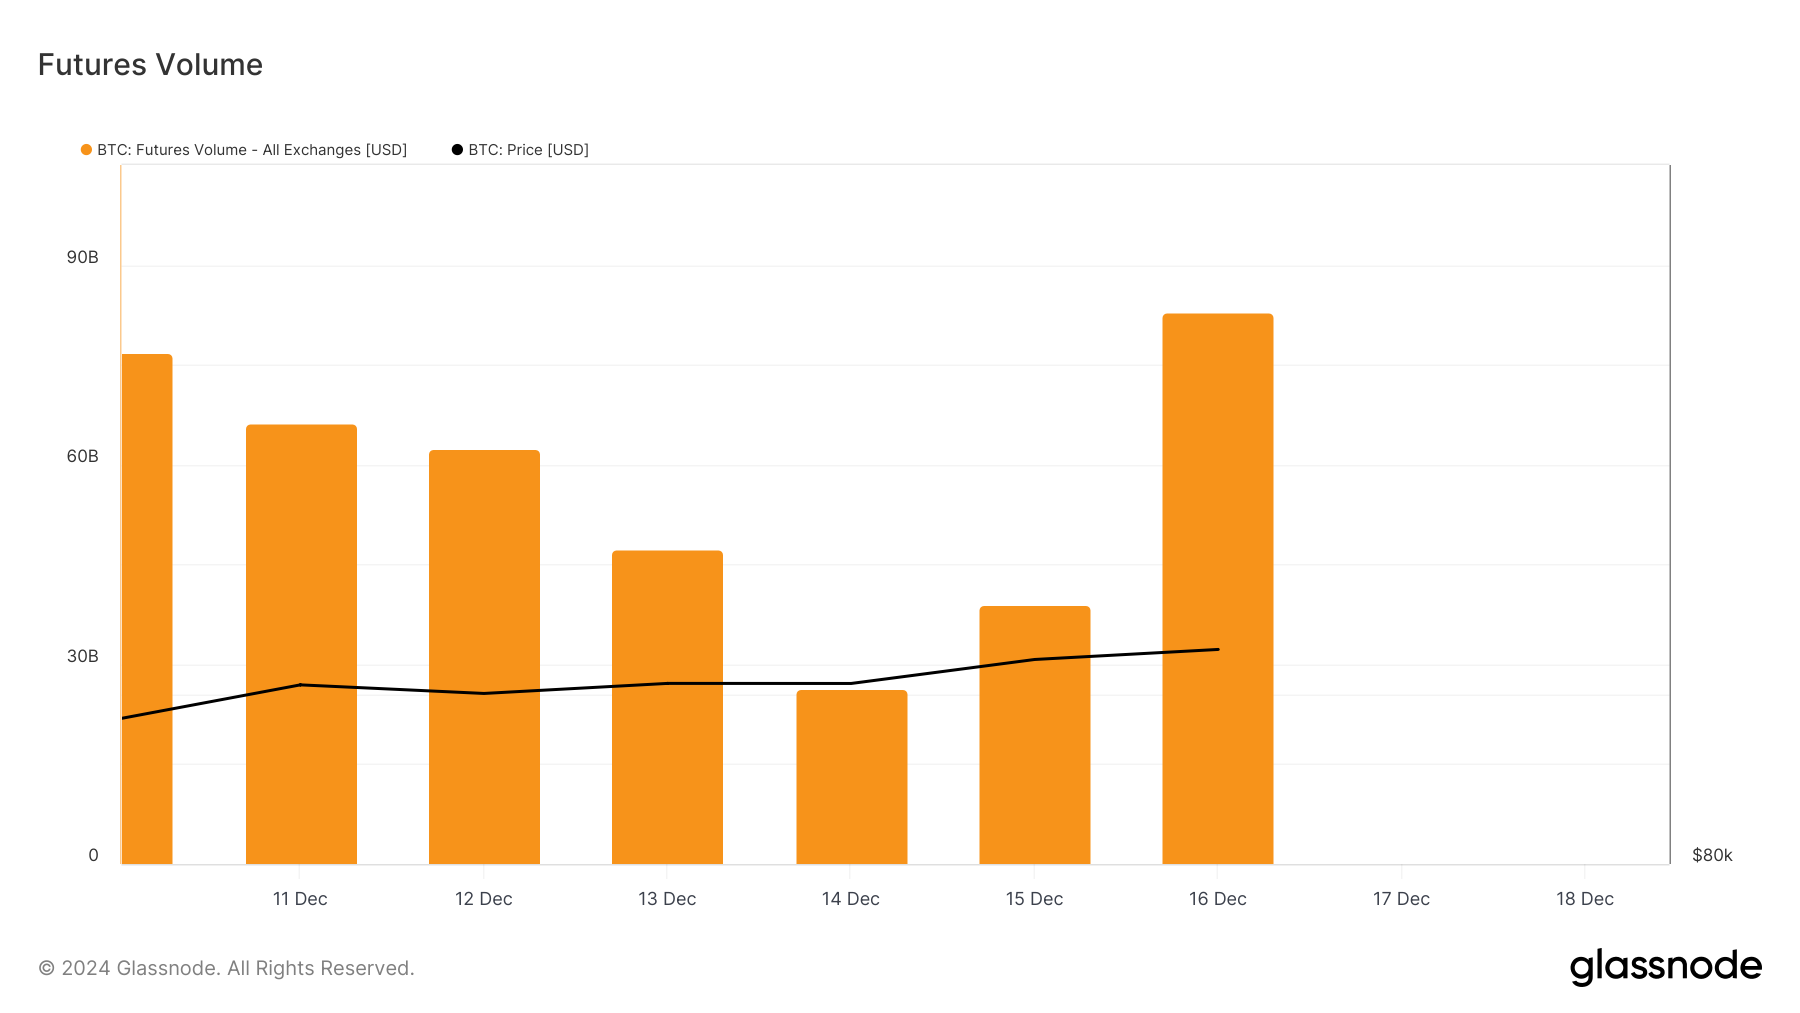
Bitcoin futures volume refers to the value of all futures contracts bought and sold over a specific period. When the value increases, traders gain more exposure to a cryptocurrency by either opening long positions or shorts.
For context, longs are traders with contracts predicting a price increase. Shorts, on the other hand, are traders betting on the price to decrease. However, a decrease in the futures volume indicates a drop in contracts opened by traders.
According to data from Glassnode, the recent BTC all-time high woke Bitcoin traders up. For the last seven days, the volume has consistently decreased before its recent hike to $82.84 billion.
Despite a spike in the volume, Bitcoin traders appear skeptical about the cryptocurrency surpassing $107,000 anytime soon, as reflected in the long/short ratio.
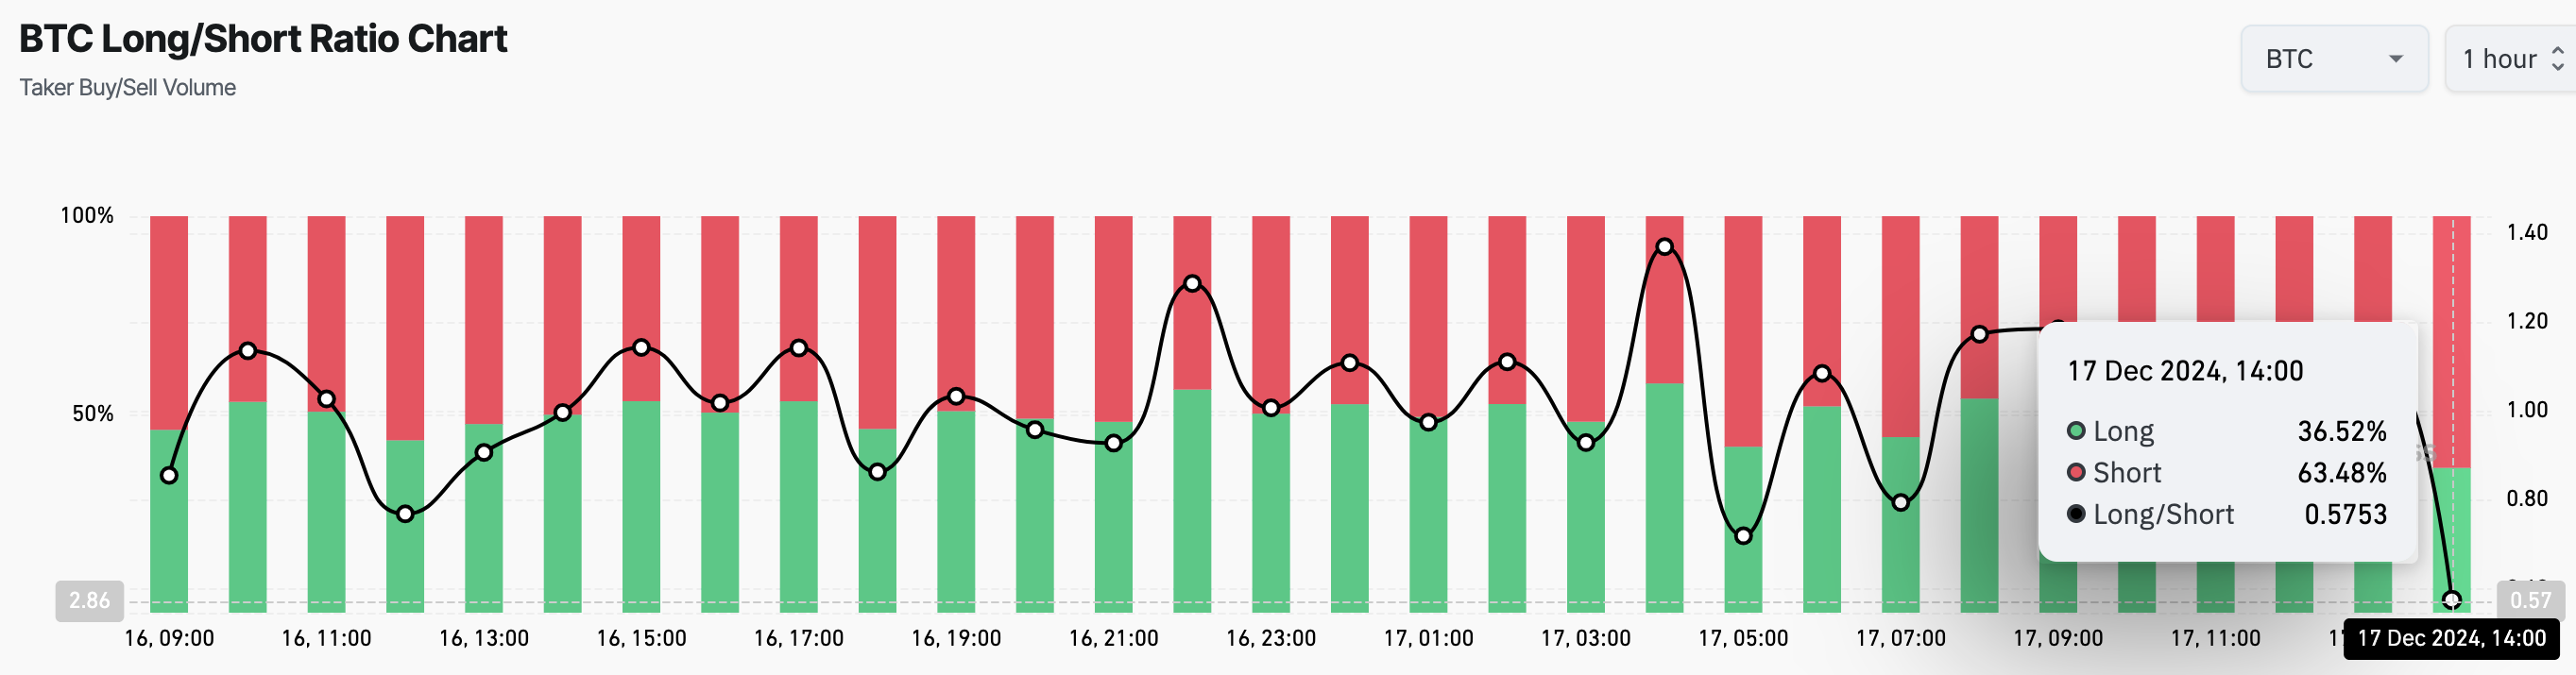
The long/short ratio serves as a barometer of investor sentiment. A ratio above 1 indicates more long positions than shorts, while a ratio below 1 signals dominance of short positions.
Data from Coinglass reveals that Bitcoin’s long/short ratio has fallen to 0.58, with short positions accounting for 63.48% of total open interest, while long positions make up just 36.52%. This disparity reinforces the notion that most traders are bracing for a short-term correction in Bitcoin’s price.
BTC Price Prediction: Drop Below $100,000 Likely
On the daily chart, the Bollinger Bands (BB), which measures volatility, have tapped Bitcoin’s price at $107,352. The BB reveals the level of volatility and also shows whether an asset is overbought or oversold.
Typically, when the upper band of the indicator touches the price, it is oversold. Conversely, when the lower band touches the price, it is oversold. Therefore, since it is the former, it appears that Bitcoin’s price is overbought and might retrace.
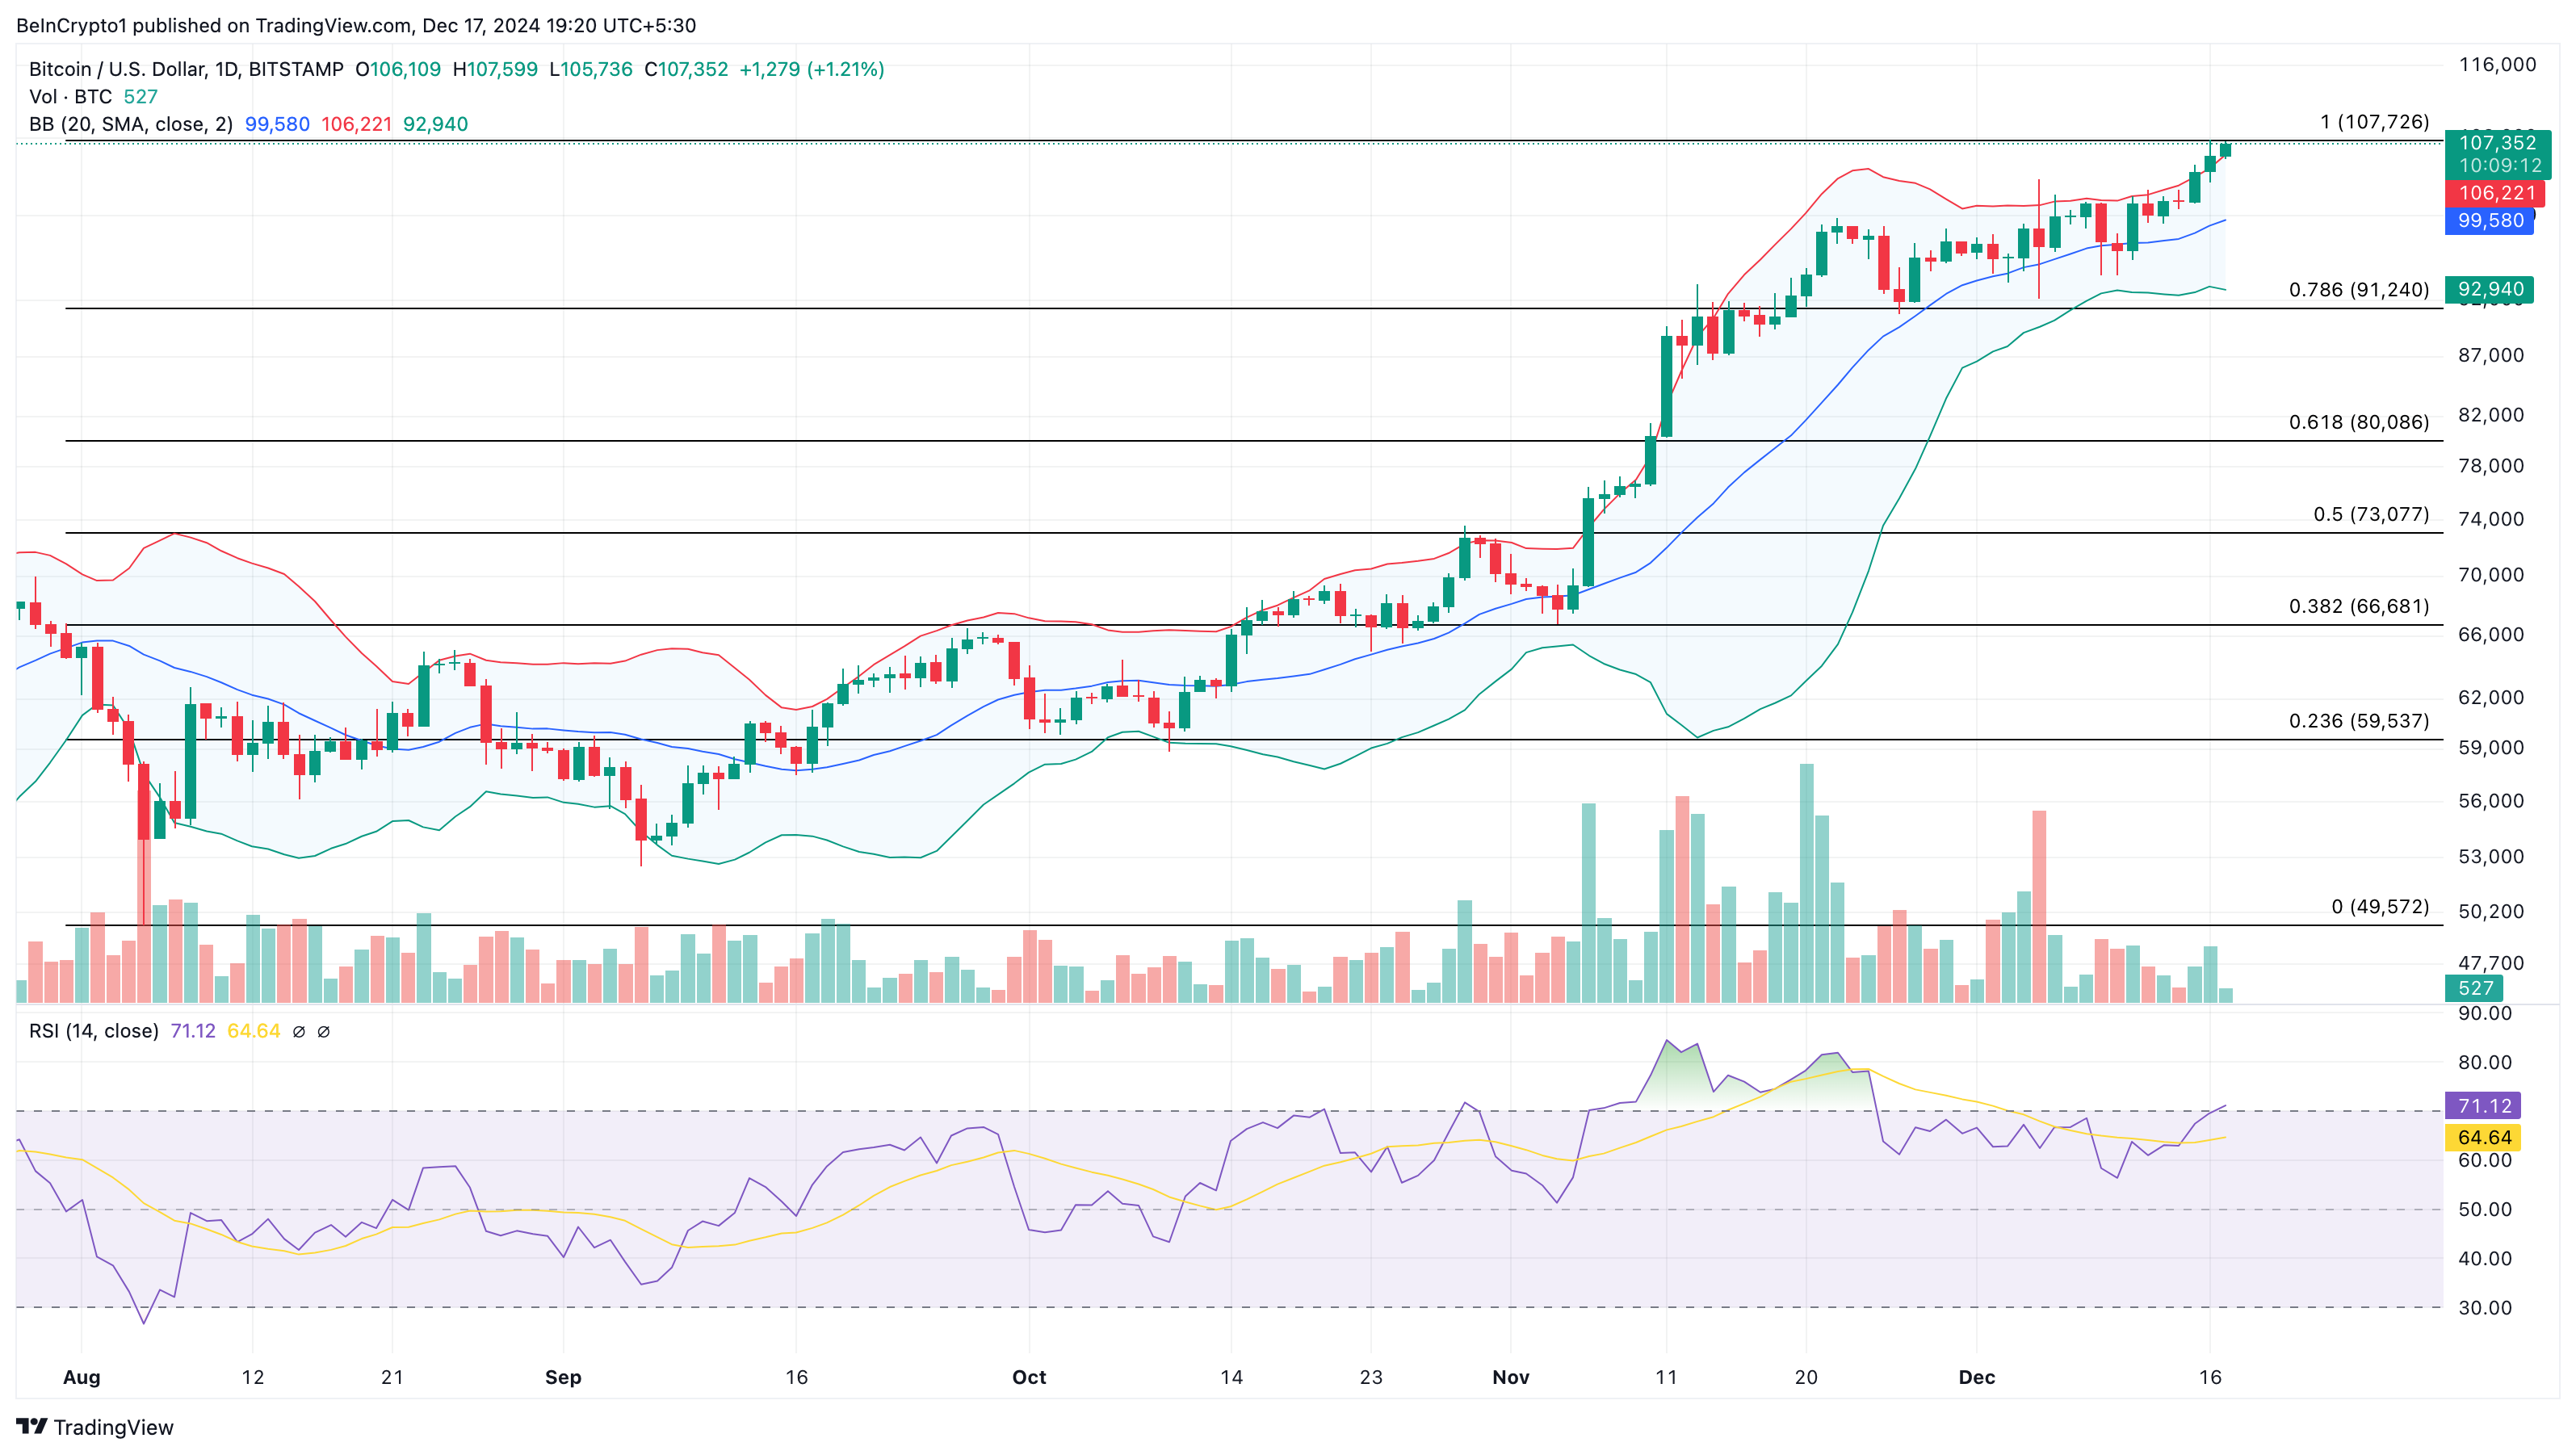
The Relative Strength Index (RSI) also supports this outlook as its reading is above 70.00, which also indicates that the BTC price is overbought. If validated, Bitcoin’s price might drop to $91,240. However, if buying pressure increases, the coin’s value might climb to $116,000.

Log in to Reply
Log in to comment your thoughtsComments
Related Articles
|Square
Get the BTCC app to start your crypto journey
Get started today Scan to join our 100M+ users