ENA’s price faces key resistance at $0.5 – Will bulls break through?

- Ethena had a bearish structure on the daily chart
- OBV moved past local highs, but it appeared unlikely that the price could follow
Ethena’s price [ENA] fell below the $0.5 support zone in February, but its decline appeared to have halted at press time. In fact, just recently, a range formation below the $0.5 resistance was spotted. This could present traders with profitable opportunities.
Bitcoin’s [BTC] volatility could also have a part to play. The world’s leading crypto visited the $92.8k resistance on Thursday, 6 March, and faced rejection once again. Will ENA also see a downward trajectory over the weekend?
ENA buyers appear to have the upper hand now
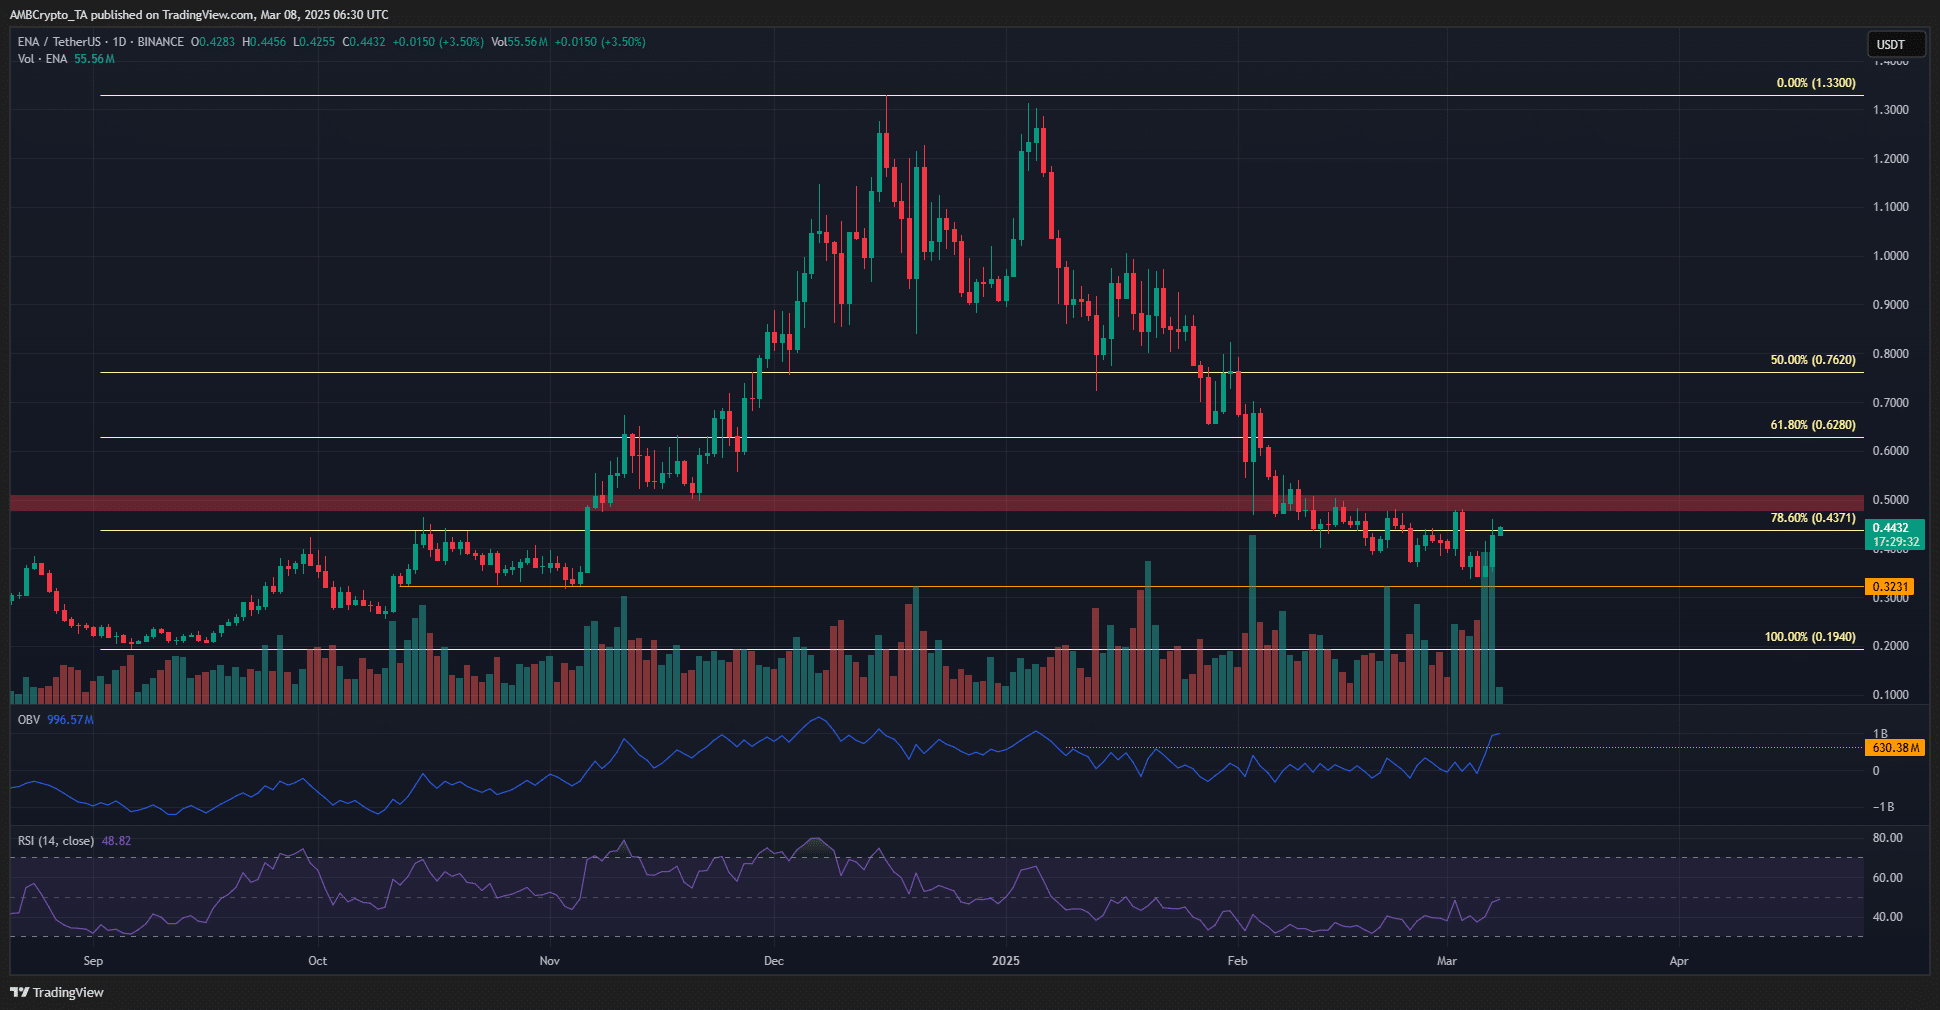
Source: ENA/USDT on TradingView
The market structure on the daily chart was bearish. The price has only made lower highs and lower lows in 2025. The most recent lower high was at $0.48, and a daily session close above that would hint at a market structure shift.
The trading volume has been high over the past couple of days, with the same reflected by the volume bars below the price. This influx of volume caused the OBV to break out beyond the last two months’ local highs.
At press time, the RSI was testing neutral 50 as resistance too, showing a potential momentum shift around the corner. Together, they hinted at a bullish move on the charts.
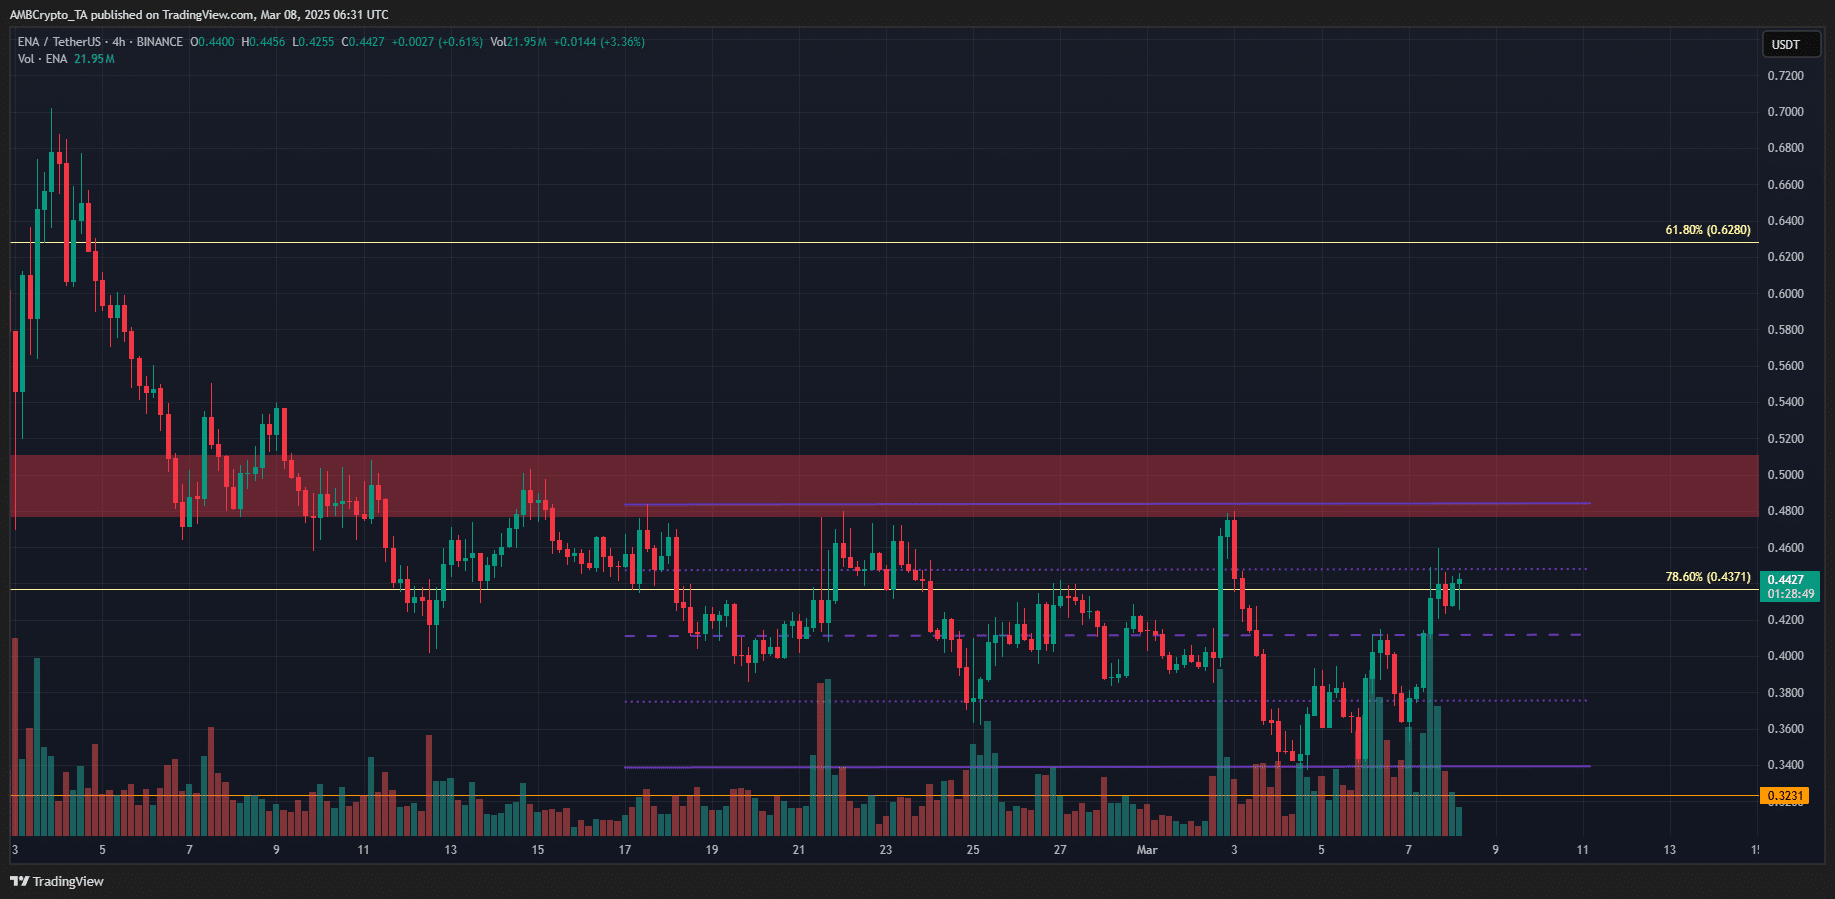
Source: ENA/USDT on TradingView
Zooming into the 4-hour chart, we can see a range formation (purple) with the highs within the $0.5 resistance zone. At press time, ENA bulls were wrestling with the range’s 25% level at $0.448.
Even if they manage to overcome it, a breakout beyond $0.5 may not yet be at hand. Despite the OBV breakout, traders should remain bearish and look to sell the retest of $0.48-$0.5. This, because the higher timeframe bias remained bearish.
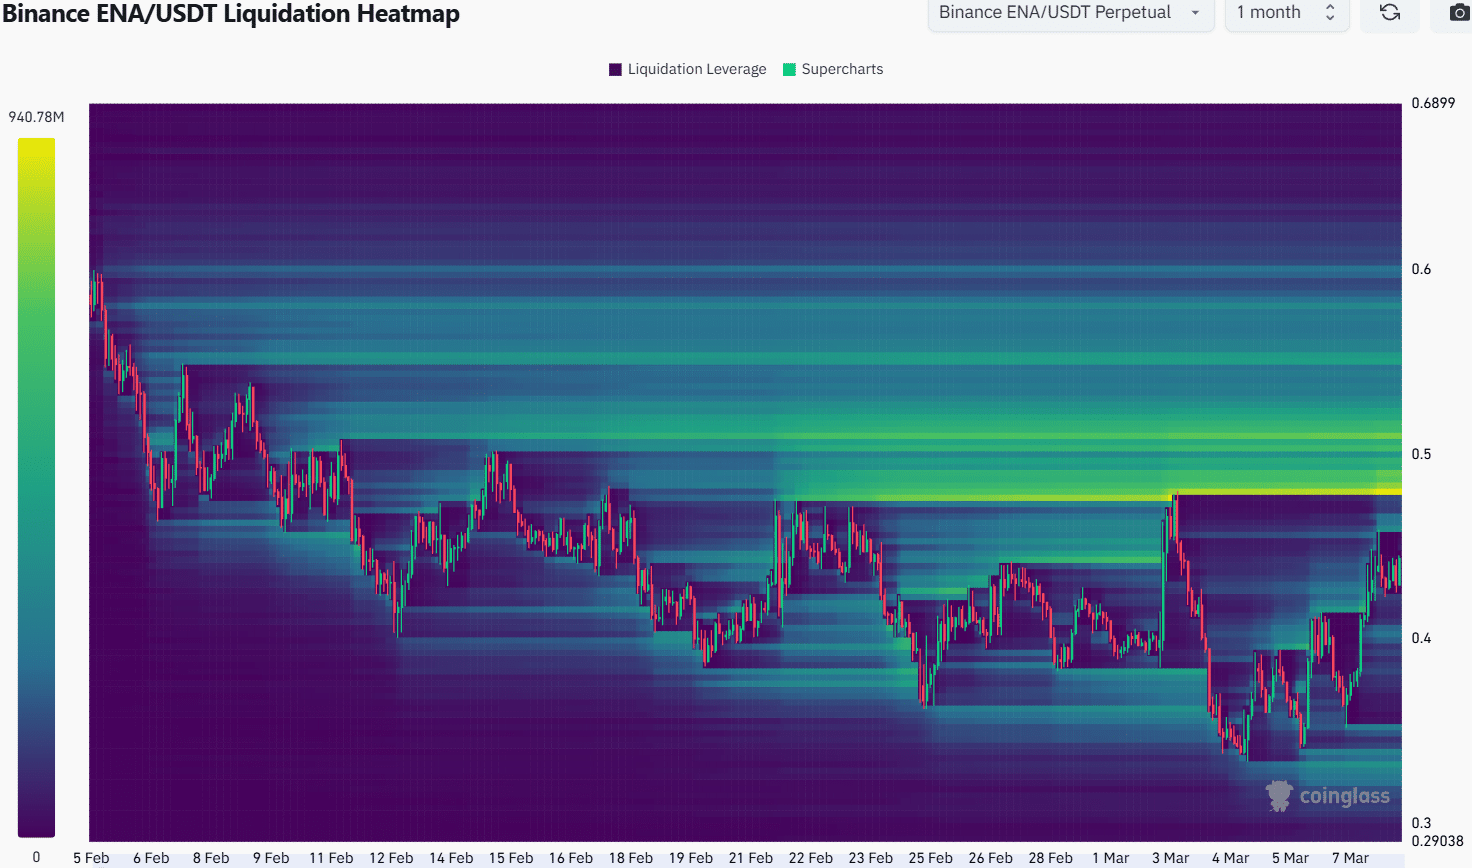
Source: Coinglass
The past month’s liquidation heatmap highlighted the $0.48-$0.515 as a strong magnetic zone. Therefore, it may be highly likely the price would test this region soon, as price is attracted to liquidity. These liquidity clusters also formed prime reversal regions.
Swing traders can use a move beyond $0.515-$0.52 to set up a stop-loss, if they were looking to sell. A move beyond $0.52 would invalidate the bearish idea laid out here. The mid-range level at $0.412 and the lows at $0.34 would be the bearish targets.
Disclaimer: The information presented does not constitute financial, investment, trading, or other types of advice and is solely the writer’s opinion
Take a Survey: Chance to Win $500 USDT

Log in to Reply
Log in to comment your thoughtsComments
Related Articles
|Square
Get the BTCC app to start your crypto journey
Get started today Scan to join our 100M+ users