Mapping Bitcoin’s road to $100K – THIS price zone is key for BTC’s next rally

- Bitcoin’s recent price action and rising CVD suggested that $81K could act as a strong support zone.
- However, market dynamics will ultimately determine whether BTC holds this bottom or dips further.
The latest Cumulative Volume Delta (CVD) and 24-hour price change analysis indicate a bullish sentiment in the Bitcoin [BTC] market. As a key on-chain metric, CVD tracks the net difference between buying and selling pressure over time.
Recent trading sessions have shown a notable uptrend in Bitcoin’s CVD, signaling that buying pressure is prevailing over selling.
More significantly, this CVD surge coincided with BTC’s $81K price level, raising speculation that this zone could serve as a local bottom for the next leg of Bitcoin’s upward trajectory.
AMBCrypto explored this possibility.
Where does Bitcoin’s local bottom lie?
Bitcoin endured a volatile week, plunging to $78K, rallying to $94K, and again retracing to $84K. With the market still reacting to Trump’s ‘trade-dump,’ another pullback remains a strong possibility.
However, a key bullish signal emerged as CVD spiked when BTC hit $81K. In the previous cycle, a similar spike at $78K preceded a 20% rally, sending BTC above $96K.
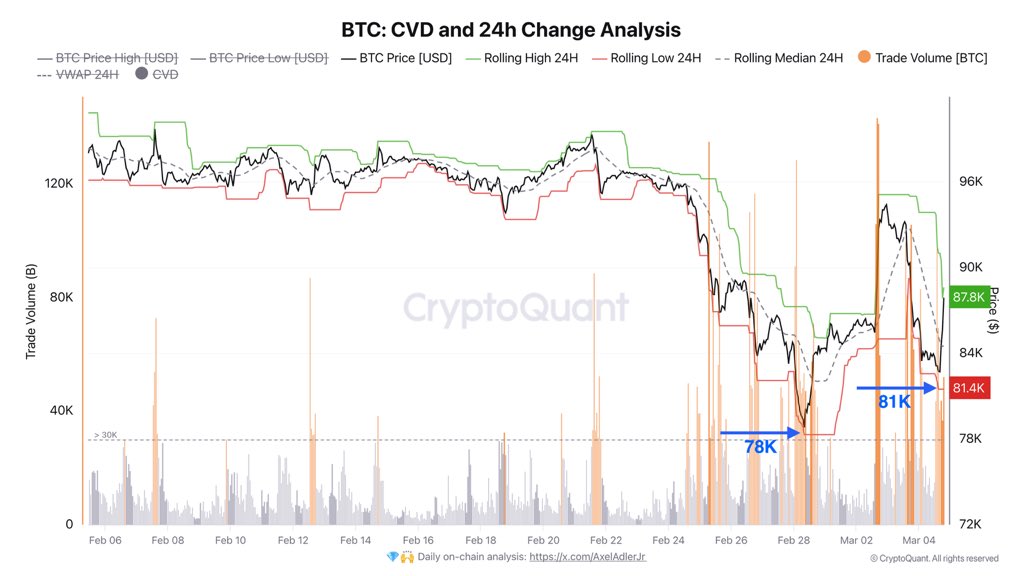
Source: CryptoQuant
Further reinforcing bullish sentiment, total exchange outflows surged to a three-week high of 75,688 BTC, signaling aggressive “dip-buying” at this key support level.
At press time, Bitcoin is up 3.96% to $87,241. In the past 24 hours, $96.16 million in short positions have been liquidated in anticipation of $100K builds.
With the upcoming Crypto Summit and CVD reflecting sustained buying pressure, is BTC gearing up for a decisive move toward its six-figure target?
Critical resistance ahead
If history repeats, the CVD, identifying a strong support zone in the $78K–$81K range, suggests a potential 20% rebound, positioning BTC above $97K.
This level holds key significance, with 4.09 million BTC accumulated at an average price, highlighted by the largest red cluster in the chart below.
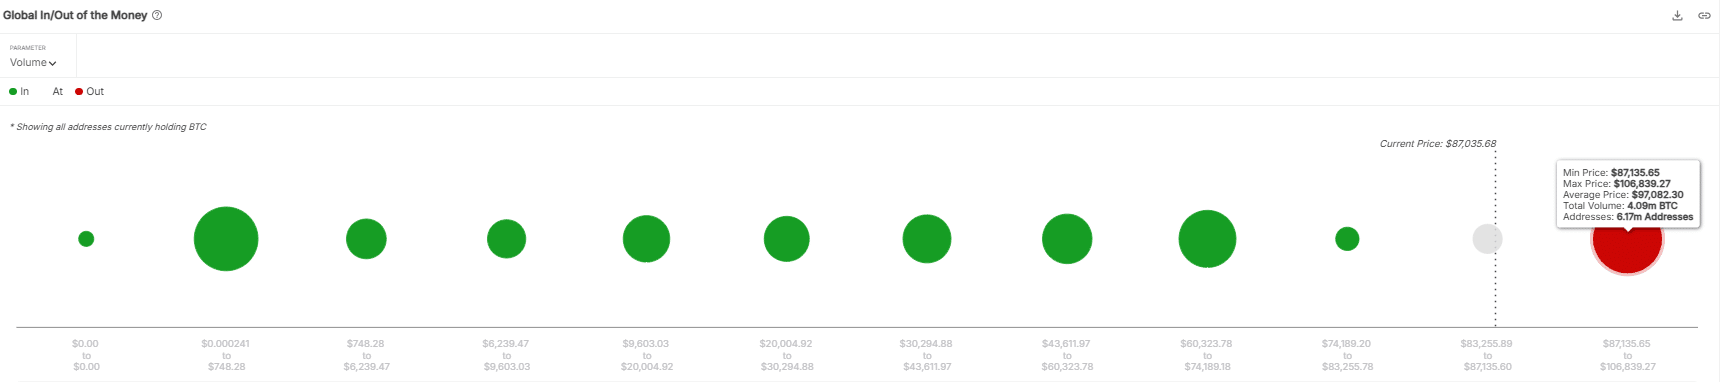
Source: IntoTheBlock
Investor HODLing sentiment faces a key test, as the likelihood of mass liquidations increases once BTC breaches resistance. Outcomes from the summit will determine the next move.
A pro-Bitcoin stance, possibly including an executive order for a Bitcoin Strategic Reserve, could turn $97K into strong support. This would set the stage for a breakout toward $100K.
Conversely, intensified profit-taking may lead BTC to retrace to the $78K–$81K range, further affected by macro headwinds.
Inflation ROSE 0.1% month-over-month to 3% in January, exceeding the Fed’s 2% target. Trump’s trade policies could also add upward inflation pressure, impacting HODLing sentiment.
With volatility high, closely monitoring resistance and support levels will be crucial in the days ahead.
Take a Survey: Chance to Win $500 USDT

Log in to Reply
Log in to comment your thoughtsComments
Related Articles
|Square
Get the BTCC app to start your crypto journey
Get started today Scan to join our 100M+ users