Previsão do preço da VeChain 2025-2031: Qual o potencial de crescimento da VET?

O token de supply chain que desafia os tradicionais — e os bancos ainda não entenderam.
Panorama Técnico
A VET não é apenas outro ativo digital. Sua arquitetura de dois tokens e parcerias corporativas reais a colocam à frente da concorrência em adoção empresarial. A blockchain prova sua utilidade além do hype especulativo.
Cenário Regulatório
Enquanto reguladores discutem stablecoins, soluções como a VeChain silenciosamente conquistam setores inteiros. A FSA japonesa já aprova seu uso em cadeias de suprimentos alimentares — um sinal claro de legitimidade crescente.
Projeções de Mercado
Analistas apontam para crescimento sustentado baseado em adoção corporativa, não em especulação de retail. A tecnologia resolve problemas reais, não apenas cria promessas no papel.
Riscos e Oportunidades
O maior desafio? Convencer investidores tradicionais que blockchain é mais que NFTs de macacos — enquanto instituições já implementam soluções VeChain há anos.
VeChain overview
| Cryptocurrency | VeChain |
| Symbol | VET |
| Price | $0.02345 (-0.5%) |
| Market Cap | $2.16 Billion |
| Trading Volume (24-h) | $68 Million |
| Circulating Supply | 85.98 Billion VET |
| All-time High | $0.2782, Apr 17, 2021 |
| All-time Low | $0.001678, Mar 13, 2020 |
| 24-h High | $0.02537 |
| 24-h Low | $0.02456 |
VeChain price prediction: Technical analysis
| Sentiment | Bearish |
| 50-Day SMA | $0.0249 |
| 200-Day SMA | $0.0252 |
| Price Prediction | $0.0492 (114.13%) |
| F & G Index | 9.03 (extreme fear) |
| Green Days | 13/30 (44%) |
| 14-Day RSI | 48.19 |
VeChain price analysis: VET falls back to $0.02300
- VET falls back toward $0.02300
- Support is at $0.02200, with resistance at $0.026 as the next key hurdle.
- Mixed market sentiment suggests consolidation between the $0.02200-$0.02400 price level.
VeChain (VET) current price analysis for September 5 shows bearish activity as price falls to $0.02300.
VeChain 1-day price chart: VET falls back to $0.02300
VeChain (VET) price action was gaining momentum rising above the $0.03000 mark but fell to the $0.02250 mark before finding strong support to initiate a trend reversal. The bullish rally enabled some recovery as price starts to rise past the $0.02550 mark. However, the momentum was short-lived and the price started to decline towards the $0.02300 before rising to $0.02345 mark where it trades at press time.
 VET/USDT Price Chart: TradingView
The Relative Strength Index (RSI) stands at 44.90 showing neutral market sentiment while suggesting that the altcoin has room for movement in either direction. The Moving Average Convergence Divergence (MACD) shows low bearish momentum at -0.00017 with recent candles showing a decreasing bearish pressure. The converging Bollinger Bands suggest that the $0.02300 support may hold the week.
VeChain 4-hour price chart: VET shows falling bearish momentum
VeChain (VET) live price trades at $0.02307 on the 4-hour chart, showing significant decay as VET falls to $0.02300 with a slight decrease of 2.5% over the last 7 days. In recent hours the price rose to $0.02400 before falling back towards the $0.02300 mark.
 VET/USDT Price Chart: TradingView
The Relative Strength Index (RSI) falls to 45.00, indicating a bearish market sentiment with strong pressure at current price level. The indicator shows room for movement in the downwards direction as VET finds the bears rejuvenated. Meanwhile, the Moving Average Convergence Divergence (MACD) shows low bullish market momentum, with the MACD line at 0.00004. However, the price may fall further if the $0.02300 level is not held.
VeChain technical indicators: Levels and action
Daily simple moving average (SMA)
| SMA 3 | $ 0.024278 | SELL |
| SMA 5 | $ 0.024109 | SELL |
| SMA 10 | $ 0.024479 | SELL |
| SMA 21 | $ 0.024493 | SELL |
| SMA 50 | $ 0.024862 | SELL |
| SMA 100 | $ 0.023882 | SELL |
| SMA 200 | $ 0.025305 | SELL |
Daily exponential moving average (EMA)
| EMA 3 | $ 0.024191 | SELL |
| EMA 5 | $ 0.024352 | SELL |
| EMA 10 | $ 0.024488 | SELL |
| EMA 21 | $ 0.024536 | SELL |
| EMA 50 | $ 0.024463 | SELL |
| EMA 100 | $ 0.024803 | SELL |
| EMA 200 | $ 0.026506 | SELL |
What to expect from VET price analysis?
 VET/USDT Price Chart: TradingView
Vechain price analysis across the daily and 4-hour charts indicates a notable recovery after making a steep decline toward the $0.024 price level. However, the recovery was met with another crash as the price falls to the $0.02330 mark.
Overall, Vechain suggests that the bulls may continue the recovery towards $0.0300 albeit with a brief trend consolidation at the current $0.0230-0.0250 price level. However, further recovery hinges on the current key level at $0.0230 and $0.0220 level which need to be defended.
Is Vechain a good investment?
VeChain stands out among crypto tokens in cryptocurrency because it focuses on supply chain management and enterprise solutions. It offers transparency and traceability across various industries, enhancing trust and efficiency in global trade.
With partnerships with major companies and a strong emphasis on real-world applications, VeChain has significant growth potential. Its innovative use cases and practical implementations appeal to businesses seeking operational improvements, making it a good investment option,
However, it is advised to do your own research and conduct experts opinion before investing in the volatile market.
Why is VET uptoday?
In recent days the price observed slight recovery towards the $0.02600 mark before crashing back towards the $0.02300 mark rapidly.
Will VeChain recover?
VeChain has experienced a notable selloff in the last thirty days, with the price falling from near the $0.03 mark to the current 0.021 level. However, industry analysts suggest that this downturn in the financial markets may not be long-term, a sentiment shared by many vet holders . Most projections indicate that VeChain could regain strength as market conditions improve, with expectations for the asset to potentially close the year between the $0.035 and $0.05 price levels.
Will VeChain reach $0.05?
Analysts suggest VeChain could attain $0.05 by 2025, as the minimum price is projected to be $0.0234 and the average price at $0.0544 , with a potential peak of $0.0572.
Will VeChain reach $0.10?
VET is expected to trade above $0.10 by 2028, with the minimum price projected at $0.10, and both the average and maximum prices reaching $0.12.
Does VET have a good long-term future?
VET has a good long-term future due to its strong use cases, growing on chain activity, and active development team.
Recent news/opinion on Vechain
VeChain recently announced its biggest UI upgrade for its crypto app VeWorld in its V2.4.0 upgrade. This has simplified browsing for the VeChain community with a fresh and smooth layout.
🧵🚀Introducing VeWorld v2.4.0 – the biggest UI/UX upgrade yet, & a key step towards VeWorld becoming crypto's Super App for IRL utility.
The VeWorld/VeBetter App experience gains:
🌱Fresh new layout
😍Better discoverability
💻App previews & info
🌐Simplified browsing
👇 $VET pic.twitter.com/5cMGc21IFZ
VeChain price prediction September 2025
In September 2025, the price of VeChain is anticipated to reach a minimum of $0.0196. The VET price can be expected to peak at $0.0292, maintaining an average of $0.023 by the end of the month.
| Month | Minimum Price ($) | Average Price ($) | Maximum Price ($) |
| September | 0.0196 | 0.023 | 0.0292 |
VeChain price prediction 2025
In 2025, the price of the VeChain coin is anticipated to touch a minimum of $0.0204, reflecting the current VeChain sentiment. The VET price might peak at $0.0499, maintaining an average of $0.0475 by the end of the year.
| Year | Minimum Price ($) | Average Price ($) | Maximum Price ($) |
| 2025 | 0.0204 | 0.0475 | 0.0499 |
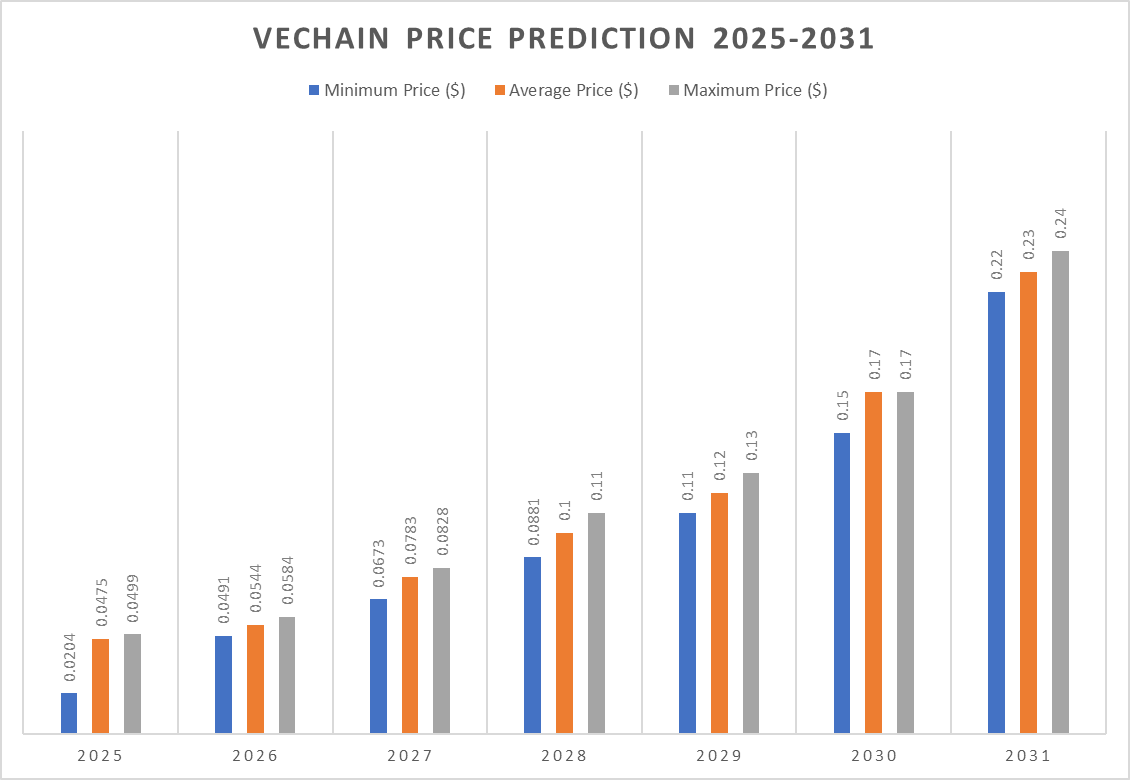
VeChain price prediction 2026-2031
| Year | Minimum Price ($) | Average Price ($) | Maximum Price ($) |
| 2026 | 0.0491 | 0.0544 | 0.0584 |
| 2027 | 0.0673 | 0.0783 | 0.0828 |
| 2028 | 0.0881 | 0.10 | 0.11 |
| 2029 | 0.11 | 0.12 | 0.13 |
| 2030 | 0.15 | 0.17 | 0.17 |
| 2031 | 0.22 | 0.23 | 0.24 |
VeChain Price Prediction 2026
For 2026, VeChain (VET) is expected to reach a minimum price of $0.0491. It could potentially climb to a high of $0.0584, averaging around $0.0544.
VeChain Price Prediction 2027
By 2027, VeChain’s price is projected to trade at a minimum value of $0.0673. It might surge to a high of $0.0828, with an average price hovering around $0.0783.
VeChain Price Prediction 2028
VeChain is estimated to trade at a minimum of $0.0881 in 2028. It might reach a maximum of $0.11, with an average value of $0.10.
VeChain Price Prediction 2029
In 2029, VeChain’s price will likely hit a floor of $0.11. Based on analysis, it could peak at $0.13, with an average expected price of $0.12.
VeChain Price Prediction 2030
The VeChain price prediction for 2030 projects a minimum price of $0.15, a maximum price of $0.17, and an average trading price of $0.17.
VeChain Price Prediction 2031
In 2031, VeChain could trade at minimum and maximum prices of $0.22 and $0.24, respectively. The price might soar to $0.24, maintaining an average of $0.23.
 Vechain Price Prediction
Vechain Price Forecast: By Analysts
| Firm | 2025 | 2026 |
| Coincodex | $0.0406 | $0.05091 |
| DigitalCoinPrice | $0.040 | $0.050 |
| CryptoPredictions.com | $0.048 | $0.054 |
Cryptopolitan’s VeChain (VET) price prediction
Cryptopolitan’s market analysis predictions show that VeChain will achieve a high of $0.0499 in 2025. In 2027, it will range between $0.0673 and $0.0828, with an average of $0.0783. In 2031, it will range between $0.22 and $0.24, with an average of $0.23. Note that these predictions are not investment advice. Seek independent professional consultation or do your research.
VeChain historic price sentiment
 VeChain Price History
- VeChain began in 2015 as a private consortium chain for blockchain applications. It transitioned to a public blockchain with the ERC-20 token VEN in 2017 and launched its mainnet as VET in 2018.
- In 2018, VeChain partnered with DHL to develop blockchain solutions for logistics but saw a significant price correction, stabilizing at lower levels.
- The price remained relatively stable in 2019 and 2020, with occasional spikes as VeChain continued developing technology and forming partnerships.
- In 2021, VeChain’s price surged to an all-time high of $0.20 in May but dropped to $0.070 by December.
- In 2022, VeChain attempted to recover but remained below $0.10, with continued volatility throughout the year and into early 2023.
- Towards the end of 2023, the price saw a slight uptick, stabilizing around $0.020 by early 2024.
- In 2024, VeChain’s price fluctuated, recovering to $0.025 by mid-March but dropping due to bearish trends, reaching a low of $0.019 by August.
- It traded around $0.021 in September but ended the month above the $0.024 mark. The price remained mostly stable in October, with the occasional bearish movement causing a decline from the $0.02400 level to start November at the $0.02100 price level.
- The asset closed November at a high level, with prices near the $0.04600 mark and a strong bullish outlook. However, the bulls only took the price higher in December, as the $0.0500 resistance was crushed swiftly.
- As of January 2025, VET traded around the $0.04300 mark as it started and closed the month around the same level.
- In February, the price fell towards the $0.03000 mark as bears took over, ending the month at $0.02800. In March, the net movement was low, but the volatility was very high, as the price fell to $0.02200 where it closed the month.
- In April the price saw an initial crash but observed sharp recovery ending the month above the $0.02600 mark. In May the price dwindled again ending the month around $0.0250. In June the price continued to struggle as it dropped to $0.0200 to end the month.
- July saw a sharp rise to the asset’s volatility with VET crossing the $0.02800 mark. However, the price could not be maintained and VET ended the month around the $0.02200 level.
