Chainlink Price Prediction 2025-2031: LINK Emerges as Strong Buy Amid Market Optimism

Oracle Network Primed for Explosive Growth as DeFi Demand Soars
Market analysts project significant upside for Chainlink's native token as institutional adoption accelerates. The decentralized oracle solution continues dominating the smart contract infrastructure space.
Technical Breakout Signals Bullish Momentum
LINK demonstrates strong technical fundamentals with consistent network growth and expanding partnership announcements. The token's utility as critical middleware positions it for sustained appreciation.
Institutional FOMO Meets Real-World Utility
Traditional finance players increasingly integrate Chainlink's verified data feeds—because nothing says 'innovation' like paying hedge fund premiums for decentralized data. The network's proven track record during market volatility reinforces its value proposition.
Price targets through 2031 reflect optimistic yet achievable projections based on current adoption curves. Market sentiment suggests LINK could outperform major cryptocurrencies during the next bull cycle.
Smart money accumulates while retail still questions the valuation—classic crypto narrative playing out once again.
Overview
| Cryptocurrency | Chainlink |
| Token | LINK |
| Price | $22.57 |
| Market Cap | $15.31B |
| Trading Volume (24-hour) | $917.85M |
| Circulating Supply | 678.09M LINK |
| All-time High | $52.88, May 09, 2021 |
| All-time Low | $0.1263, Sep 23, 2017 |
| 24-hour High | $23.42 |
| 24-hour Low | $22.22 |
Chainlink price prediction: Technical analysis
| Metric | Value |
| Price prediction | $ 24.27 (7.86%) |
| Price Volatility (30-day variation) | 9.66% |
| 50-day SMA | $ 20.87 |
| 14-day RSI | 47.54 |
| Sentiment | Neutral |
| Fear & Greed Index | 48 (Neutral) |
| Green days | 17/30 (57%) |
| 200-day SMA | $ 16.13 |
Chainlink price analysis: LINK, a detailed look at recent price movements
- LINK is facing strong resistance at $23.18, with recent attempts to break above it failing. This indicates selling pressure at higher levels.
- The $22.13 level is critical for LINK. If it holds, there may be a chance to test resistance again, but a break below could lead to further declines.
- LINK’s price action on the 4-hour chart shows a downtrend with lower highs and lows, suggesting weak market sentiment and potential for further downside.
On September 5, 2025, Chainlink (LINK) is trading at $22.13, reflecting a decline of 1.73% within the last 24 hours. This price point is hovering close to the established support level of $22.13, with resistance at $23.18. LINK has faced challenges in maintaining upward momentum, dropping from higher levels in recent trading sessions. Today, the coin’s performance showcases a slight retracement, indicating market uncertainty and potential sideways movement in the short term.
Chainlink 1-day price chart: LINK daily price action and key levels
Looking at the daily chart for LINK, the most recent trading activity points to a struggle at resistance levels around $23.18. The price attempted to break through this level but failed, as seen in the sharp retracement following a brief upward spike earlier in the day. At present, LINK is consolidating just above the support level of $22.13, suggesting a critical area to monitor for further price action. A breakdown below this support likely leads to deeper retracements toward $21.50 or lower, signaling a continuation of the downtrend.
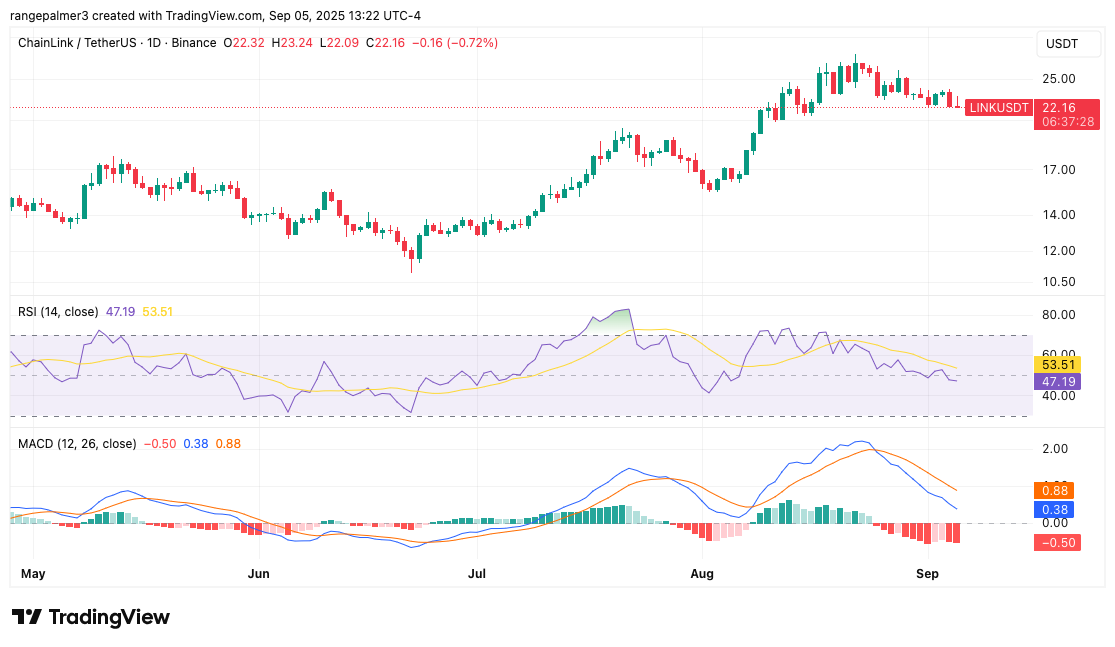 LINK/USDT Chart: TradingView
The Relative Strength Index (RSI) on the daily chart is positioned just above the neutral zone, indicating that LINK is neither overbought nor oversold. However, the RSI’s flat trajectory suggests that momentum is weak, and market participants are undecided. If LINK can hold its ground around $22.13, there could be another attempt at breaking resistance. Conversely, failure to maintain this level could open up the possibility for further losses, especially if market sentiment remains bearish.
Chainlink 4-hour price chart: LINK short-term price trends and market sentiment
On the 4-hour chart, LINK shows a clear downtrend, with a series of lower highs and lower lows forming throughout the day. The recent price action reveals a sharp drop after touching the $23.18 resistance level, which has proven to be a substantial barrier. As the price struggles to recover, it now finds support at $22.13, where buyers have been stepping in to prevent further declines. If LINK fails to hold above this support, the next potential area of support is around $21.90, which could serve as a key zone for reversal.
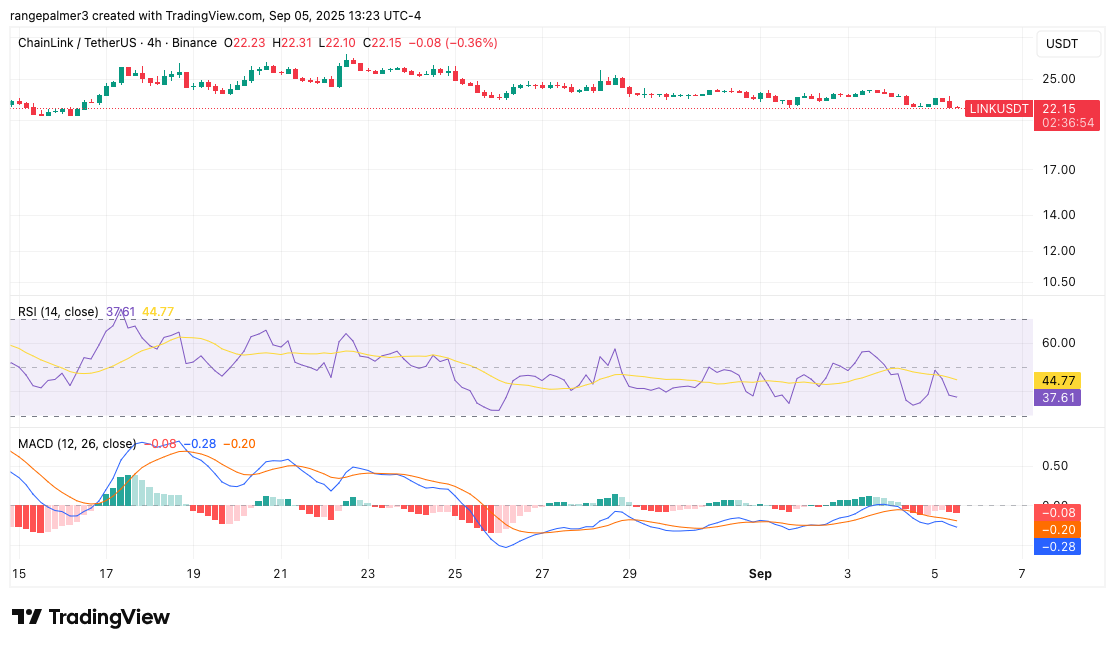 LINK/USDT Chart: TradingView
In the short term, LINK’s price action is increasingly driven by the balance of selling pressure near resistance and buying interest at support. The moving averages on the 4-hour chart are currently showing a bearish crossover, signaling that sellers may have the upper hand in the near future. Should the price drop below $22.00, the bearish momentum could accelerate, triggering further downside pressure. Traders will need to observe whether the price can reclaim key support or if further consolidation or weakness will prevail.
Chainlink technical indicators: levels and action
Daily simple moving average (SMA)
| Period | Value | Action |
| SMA 3 | $ 23.52 | SELL |
| SMA 5 | $ 23.55 | SELL |
| SMA 10 | $ 24.10 | SELL |
| SMA 21 | $ 24.20 | SELL |
| SMA 50 | $ 20.87 | BUY |
| SMA 100 | $ 17.37 | BUY |
| SMA 200 | $ 16.13 | BUY |
Daily exponential moving average (EMA)
| Period | Value | Action |
| EMA 3 | $ 23.35 | SELL |
| EMA 5 | $ 23.57 | SELL |
| EMA 10 | $ 23.86 | SELL |
| EMA 21 | $ 23.35 | SELL |
| EMA 50 | $ 21.05 | BUY |
| EMA 100 | $ 18.86 | BUY |
| EMA 200 | $ 17.46 | BUY |
What to expect from Chainlink?
Looking ahead, the outlook for Chainlink (LINK) largely depends on how the price reacts to key levels. The $22.13 support is critical in determining whether LINK can consolidate or face further downside. If the price holds above this level, there may be attempts to test the $23.18 resistance again. However, a break below $22.13 could open the door to deeper declines, potentially testing levels around $21.50 or lower in the short term.
In the near future, LINK’s price is likely to remain driven by the ongoing tug-of-war between buyers and sellers at these key levels. If LINK fails to break the resistance at $23.18, bearish sentiment could dominate, with further downside pressure if the price drops below $22.00. Traders should closely monitor price movements around support and resistance levels for potential short-term opportunities.
Is Chainlink a good investment?
Chainlink (LINK) faces a critical support level at $22.13 and resistance at $23.18, indicating market uncertainty. In the short term, LINK could see further downside if it breaks support, but if it holds above $22.13, there may be potential for recovery.
For long-term investors, Chainlink’s role in DeFi and blockchain oracles offers strong potential. However, given the current market volatility, short-term traders should remain cautious. As always, thorough research and risk assessment are recommended before investing.
Why is the LINK price down today?
As of September 5, 2025, Chainlink (LINK) is down by 1.73%, trading at $22.13. The price decline is primarily driven by a failure to break above the key resistance level at $23.18. Despite earlier attempts, the price was met with strong selling pressure, leading to a retracement and consolidation at the $22.13 support level. This price movement reflects a struggle between buyers and sellers, with the market uncertain about the next direction.
Additionally, the overall market sentiment remains weak, as shown by the downtrend in LINK’s 4-hour chart, with lower highs and lower lows. This suggests that traders are cautious, and the market is more inclined towards selling than buying in the short term. Until a clear breakout occurs, LINK’s price could remain under pressure, with further downside potential if the $22.13 support level is breached.
Will Chainlink reach $50?
Based on long-term forecasts, Chainlink (LINK) is projected to reach $50 by 2027, indicating potential future price movements as its ecosystem and user adoption continue to grow.
Will Chainlink reach $100?
Chainlink can reach $100 in the year 2029, per expert predictions.
Does Chainlink have a promising long-term future?
Chainlink shows some stabilization and potential for recovery, indicating the token may have a promising long-term future.
Chainlink price prediction September 2025
For September 2025, Chainlink is primed for notable growth. The minimum projected trading price is $21.59, with an average of around $23.61, relative to the current Chainlink price. LINK is expected to attain a peak price of $24.29.
| Chainlink Price Prediction | Potential Low | Average Price | Potential High |
| Chainlink Price Prediction September 2025 | $21.59 | $23.61 | $24.29 |
Chainlink (LINK) price prediction 2025
The market price for LINK is expected to reach a maximum of $30 in 2025. However, traders can expect a minimum trading price of $14, which is influenced by the overall market capitalization and an expected average trading price of $19.77.
| Chainlink Price Prediction | Potential Low | Average Price | Potential High |
| Chainlink Price Prediction 2025 | $25.41 | $26.30 | $27.95 |
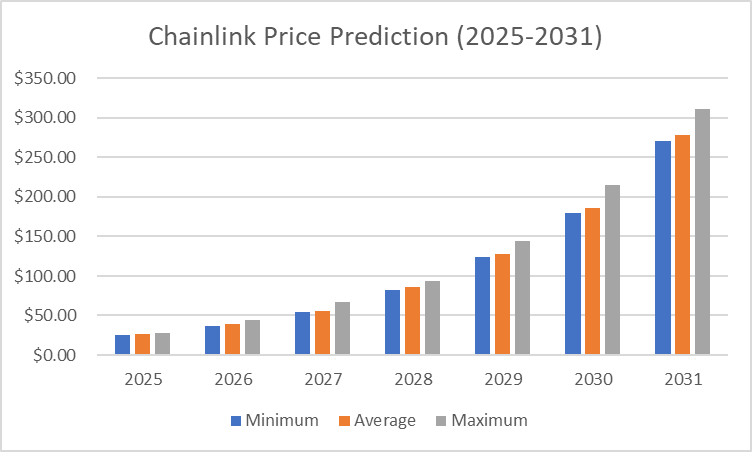
Chainlink price prediction 2026-2031
| Year | Minimum | Average | Maximum |
| 2026 | $37.29 | $38.60 | $44.70 |
| 2027 | $54.55 | $56.09 | $66.58 |
| 2028 | $82.75 | $85.56 | $93.17 |
| 2029 | $123.71 | $127.98 | $143.84 |
| 2030 | $179.55 | $185.95 | $214.50 |
| 2031 | $270.69 | $278.13 | $310.57 |
Chainlink price prediction 2026
In 2026, Chainlink is expected to reach a maximum value of $44.70, a minimum price of $37.29, and an average value of $38.60.
Chainlink price prediction 2027
In 2027, LINK’s average price is expected to be $56.09; its minimum and maximum trading prices, reflecting its historical performance, are predicted to be $54.55 and $66.58, respectively.
Chainlink price prediction 2028
The price of Chainlink is predicted to reach a minimum level of $82.75 in 2028. LINK can reach a maximum level of $93.17 and an average price of $85.56.
Chainlink price prediction 2029
The Chainlink price prediction for 2029 suggests a minimum price of $82.75, a maximum price of $143.84, and an average forecast price of $127.98, considering the total crypto market cap.
Chainlink price prediction 2030
In 2030, Chainlink prediction expects LINK to reach a maximum value of $214.50, a minimum price of $179.55, and an average value of $185.95.
Chainlink price prediction 2031
The price of Chainlink is predicted to reach a minimum value of $270.69 in 2031. If the bulls hold, investors can anticipate a maximum cost of $310.57 and an average trading price of $278.13.
Chainlink market price prediction: Analysts’ LINK price forecast
| Firm Name | 2025 | 2026 |
| DigitalCoinPrice | $49.55 | $57.76 |
| CoinCodex | $ 34.68 | $ 70.97 |
Cryptopolitan’s Chainlink price prediction
According to our Chainlink price forecast, the coin’s market price might reach a maximum value of $27.95 by the end of 2025. In 2026, the value of LINK could surge to a maximum cost of $44.70.
Chainlink’s historic price sentiment
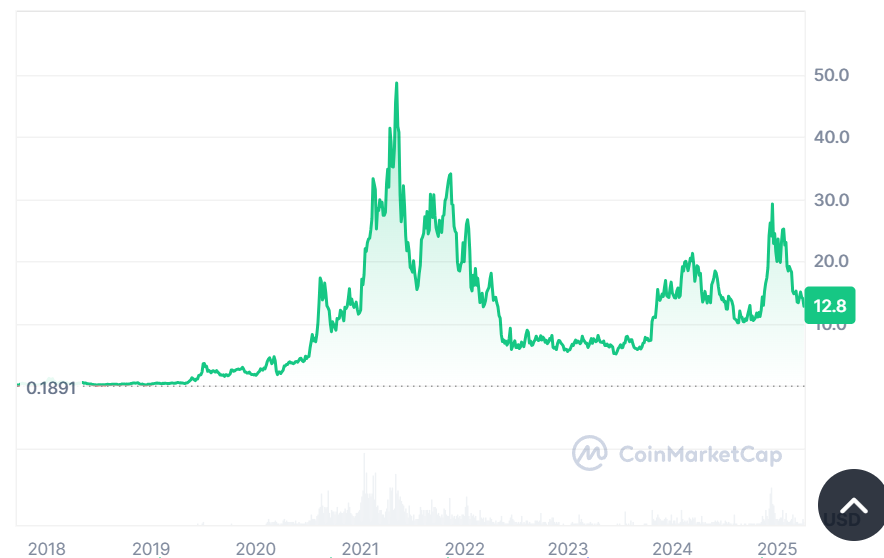
Chainlink price history: Coinmarketcap
- Chainlink launched at around $0.20 and remained under $1 throughout 2018, with moderate market cap growth. In 2019, LINK had substantial growth, reaching $1 in May and peaking around $3 by year-end, driven by its utility in providing reliable data feeds for smart contracts.
- 2020 marked a breakout year as LINK surged from $2 to $20 by August, fueled by DeFi demand. In 2021, it reached an all-time high of around $52 in May but dropped to $22 by mid-year due to market volatility.
- In 2022, LINK ranged between $15 and $25 amid broader market corrections. In 2023, it further declined, stabilizing in the $6 to $13 range as investor sentiment cooled.
- Starting 2024 at $15, LINK briefly spiked to $18 in February before falling to $12 by April. The coin’s price has fluctuated throughout 2024, peaking near $15 in May, dropping to around $10 by August, and stabilizing between $10 and $12.28 in October. In November, LINK is trading within the range of $10.68 to $11.94. In December, LINK maintained a range of $18.43 to $30.94.
- In January 2025, Chainlink peaked at $22.9 but lost momentum towards the end of the month, leading to a trading range of $19.20- $21.00 in February.
- In March 2025, Chainlink (LINK) experienced a strong upward trend, starting at approximately $13.73 and steadily rising to $16.02, with periods of volatility.
- In April, Chainlink (LINK) showed relatively stable price movement, fluctuating between $10.7 and $15.3, indicating volatility within a broad trading range.
- In May, Chainlink (LINK) started trading at approximately $14.20 and experienced some price swings, dipping below $13.90 at its lowest point. As of the latest data, the price has slightly recovered and is currently around $14.06, showing mild volatility.
- Chainlink (LINK) fluctuated between $11.5 and $15, experiencing a sharp mid-June dip but essentially stabilizing around $13.1 by early July.
- In August, Chainlink (LINK) traded in the price range of approximately $15.8 to $16.6, with its latest price reaching $16.6 on August 4th.
- Chainlink (LINK) price ranged between a high of $23.19 and a low of around $22.20, currently trading near $22.71, as of September 2025.
