BTCC
/
BTCC Square
/
Thecryptobasic
/
Solana Stalls at Critical Juncture—Double Top Threat Looms Over $215 Bull Target
Solana Stalls at Critical Juncture—Double Top Threat Looms Over $215 Bull Target

0
Solana’s price action has gone stale—trading sideways while bulls and bats battle for control. The dreaded double-top pattern flashes warning signs, but crypto’s hopium dealers still whisper about a breakout toward $215.
Can SOL defy gravity? Or will it join the graveyard of overleveraged ’next Ethereum killers’? Traders watch the charts like Wall Street watches CNBC—desperate for a narrative, any narrative, to justify their positions.
Meanwhile, the real money’s probably being made by the guys selling shovels (read: expensive validator hardware) during this gold rush.
 Solana Price Chart
The 50% Fibonacci level at $165 acts as the lower boundary, while a close positioning of the 200-day EMA at $163 provides additional support. Moreover, a positive crossover between the 50-day and 100-day EMAs signals a possible trend reversal.
However, the MACD and signal lines have yet to achieve a bullish crossover, despite moving closely together. As the consolidation continues, the risk of a bearish reversal from a falling wedge breakout increases.
According to Fibonacci levels, a potential upside breakout could reach $215, marked by the 78.60% retracement, with an extended price target near $261.
On the downside, failure to hold bullish support above $165 could test the 50-day EMA at $158, followed by the 38.20% Fibonacci level at $148. Consequently, a breakdown may threaten the $150 psychological level.
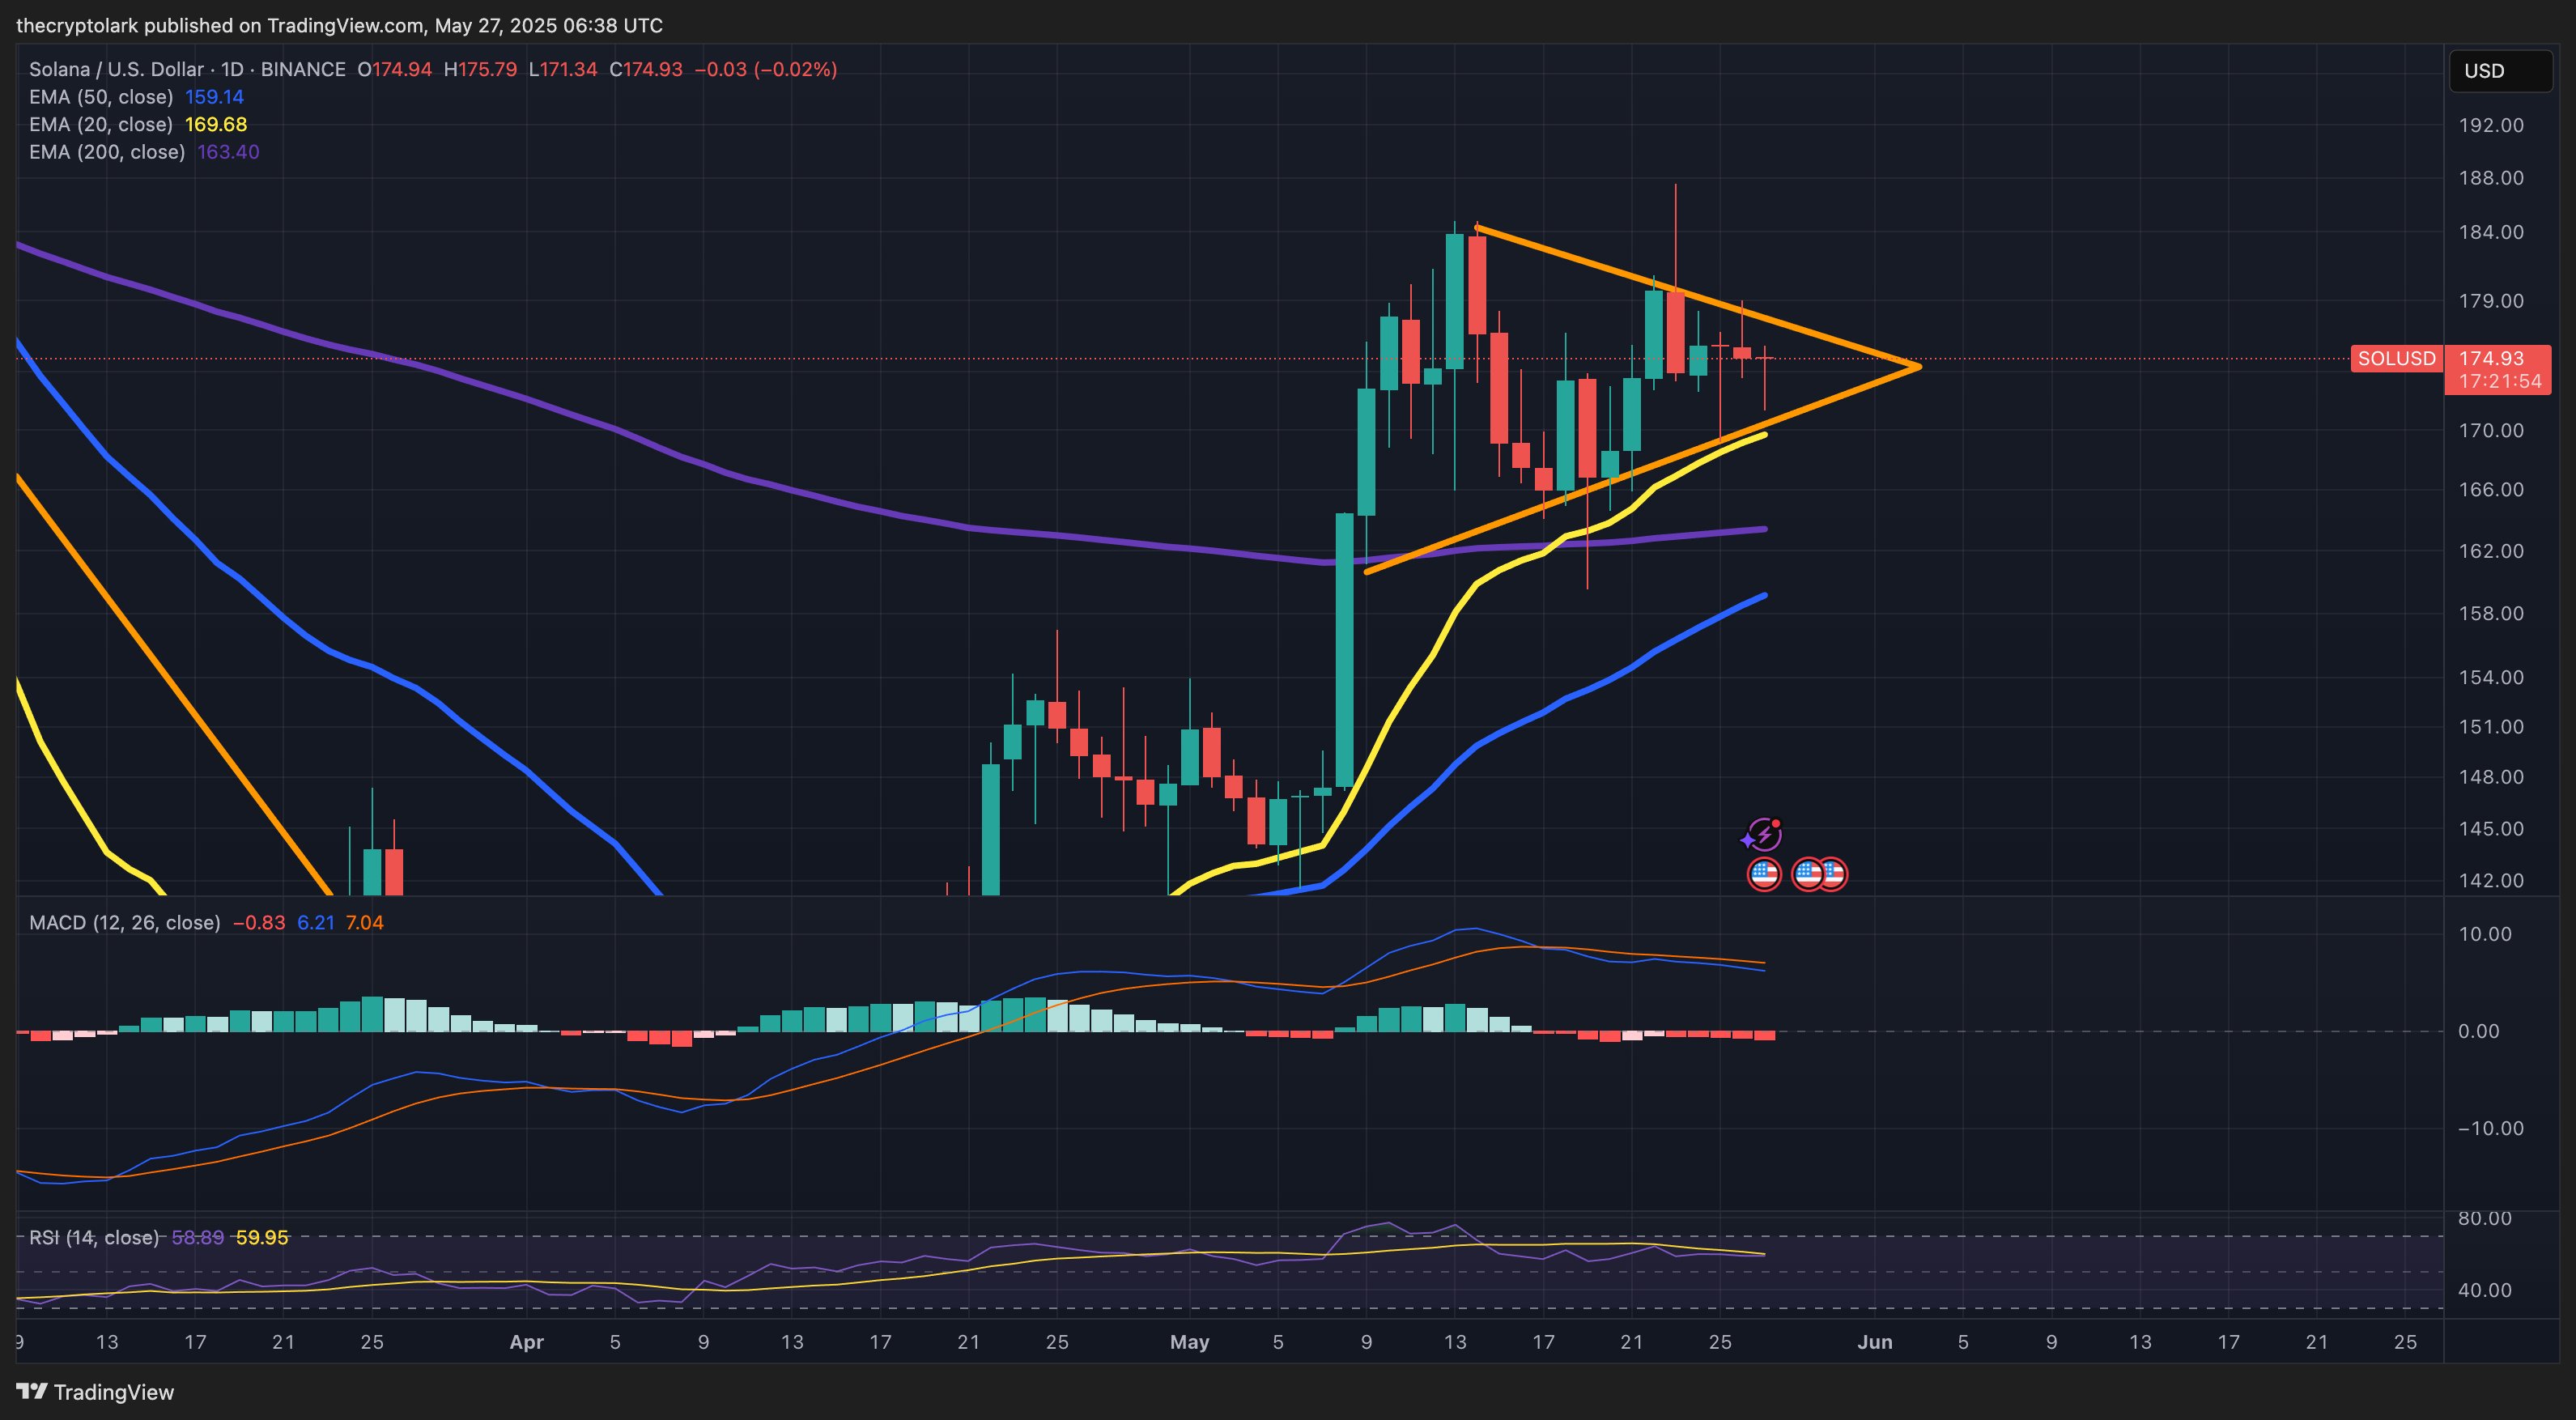
Analyst Targets $200 With Bullish Pennant
As Solana consolidates, crypto analyst Lark Davis identifies a bullish pennant forming on the daily chart. Following the bull run in early May, the symmetrical triangle pattern suggests a potential breakout rally to $200 if bulls maintain control.
The analyst noted critical support levels, including the 20-day EMA at $169 and the 200-day EMA at $163.
Solana Price Chart
The 50% Fibonacci level at $165 acts as the lower boundary, while a close positioning of the 200-day EMA at $163 provides additional support. Moreover, a positive crossover between the 50-day and 100-day EMAs signals a possible trend reversal.
However, the MACD and signal lines have yet to achieve a bullish crossover, despite moving closely together. As the consolidation continues, the risk of a bearish reversal from a falling wedge breakout increases.
According to Fibonacci levels, a potential upside breakout could reach $215, marked by the 78.60% retracement, with an extended price target near $261.
On the downside, failure to hold bullish support above $165 could test the 50-day EMA at $158, followed by the 38.20% Fibonacci level at $148. Consequently, a breakdown may threaten the $150 psychological level.
Analyst Targets $200 With Bullish Pennant
As Solana consolidates, crypto analyst Lark Davis identifies a bullish pennant forming on the daily chart. Following the bull run in early May, the symmetrical triangle pattern suggests a potential breakout rally to $200 if bulls maintain control.
The analyst noted critical support levels, including the 20-day EMA at $169 and the 200-day EMA at $163.
By:

Log in to Reply
Log in to comment your thoughtsComments
Related Articles
|Square
Get the BTCC app to start your crypto journey
Get started today Scan to join our 100M+ users