Previsão de preço do HBAR 2026-2032: Hedera Hashgraph a caminho de testar sua máxima histórica?
Hora de publicação:
2026-08-20 06:50:00
A Hedera Hashgraph (HBAR) emite um alerta aos investidores: o ativo digital, que se beneficiou do mercado altista de criptomoedas em 2021, enfrenta agora uma iminente correção de 10% no curto prazo. Esta é a principal preocupação que surge em meio às projeções otimistas de longo prazo para a rede, que vislumbra um futuro promissor no setor de blockchain. Para 2026, a expectativa é de que o HBAR negocie entre US$ 0,1874 e US$ 0,2416, com preço médio de US$ 0,218. Contudo, a perspectiva de alta se consolida nos anos seguintes: em 2029, a criptomoeda pode atingir um máximo de US$ 0,7513, com média de US$ 0,6367, antes de um período de consolidação. Até 2032, as projeções indicam que o HBAR poderá oscilar entre US$ 0,4875 e US$ 0,6167, com uma média de US$ 0,5521, reforçando a visão de que, apesar dos solavancos, o caminho é de valorização no longo prazo.
Overview
| Cryptocurrency | Hedera Hashgraph |
| Ticker | HBAR |
| Current Price | $0.07166 |
| Market Cap | $3.13B |
| Trading Volume (24Hr) | $71.99M |
| Circulating Supply | 42.39 Billion HBAR |
| All-time High | $0.5701 on Sep 16, 2021 |
| All-time Low | $0.01001 on Jan 03, 2020 |
| 24-hour High | $0.07176 |
| 24-hour Low | $0.06734 |
HBAR price prediction: Technical analysis
| Metric | Value |
| Volatility | 2.73% (Medium) |
| 50-day SMA | $ 0.06890 (SELL) |
| 200-day SMA | $ 0.08457 (SELL) |
| Sentiment | Bearish |
| Fear & Greed Index | 62 (Greed) |
| Green Days | 13/30 (43%) |
Hedera Hashgraph (HBAR) price analysis
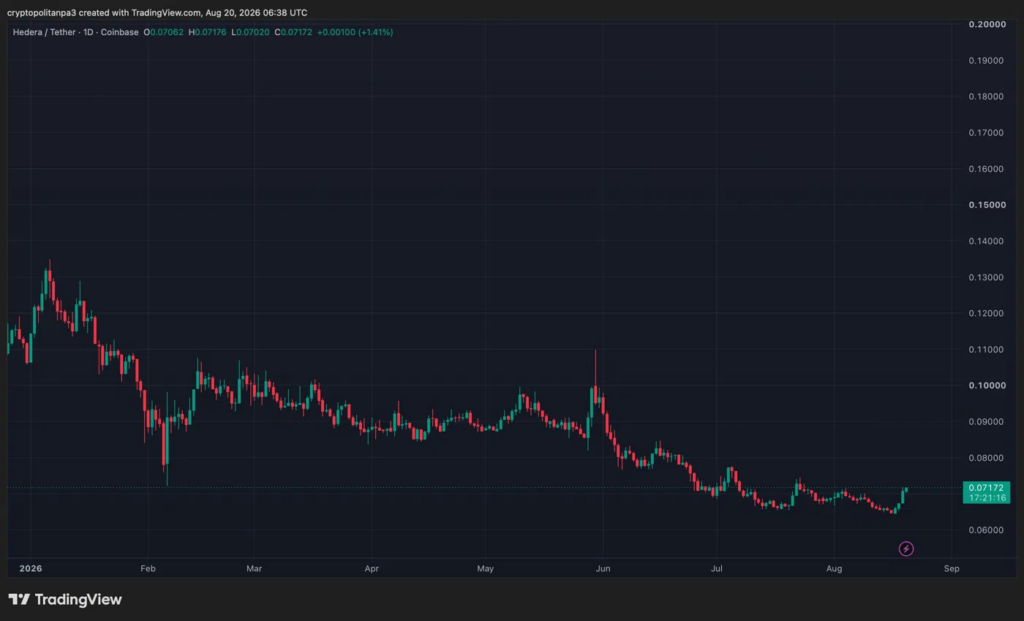
- HBAR trades near $0.070–$0.072, up roughly 1.4%-5% today, breaking above the tight $0.068–$0.070 range it held for weeks since mid-July on a surge in trading volume.
- Support now sits at $0.068–$0.070 (former resistance-turned-support), with resistance at $0.072–$0.075. A daily close above $0.075 could open a path toward $0.08–$0.09, while a failure to hold $0.068 risks slipping back into the prior range.
- The breakout looks driven by short covering and derivatives momentum, reinforced by real fundamentals — a record daily transaction volume and steady spot ETF inflows (no full week of net outflows) — pointing to genuine institutional interest behind the move.
HBAR price analysis 1-day chart
Hedera HBAR price prediction 2026-2032
Hedera market price prediction: Analysts’ HBAR price forecast
| Firm | 2026 | 2027 |
| Coincodex | $ 0.1296 | $ 0.1250 |
| DigitalCoinPrice | $0.0909 | $0.0962 |
Cryptopolitan’s Hedera Hashgraph price forecast
According to Cryptopolitan, HBAR is expected to reach a maximum price of $0.2371 by the end of 2026 and $0.0847 in 2027. Note that the predictions are not investment advice.
Hederah Hashgraph’s historic price sentiment
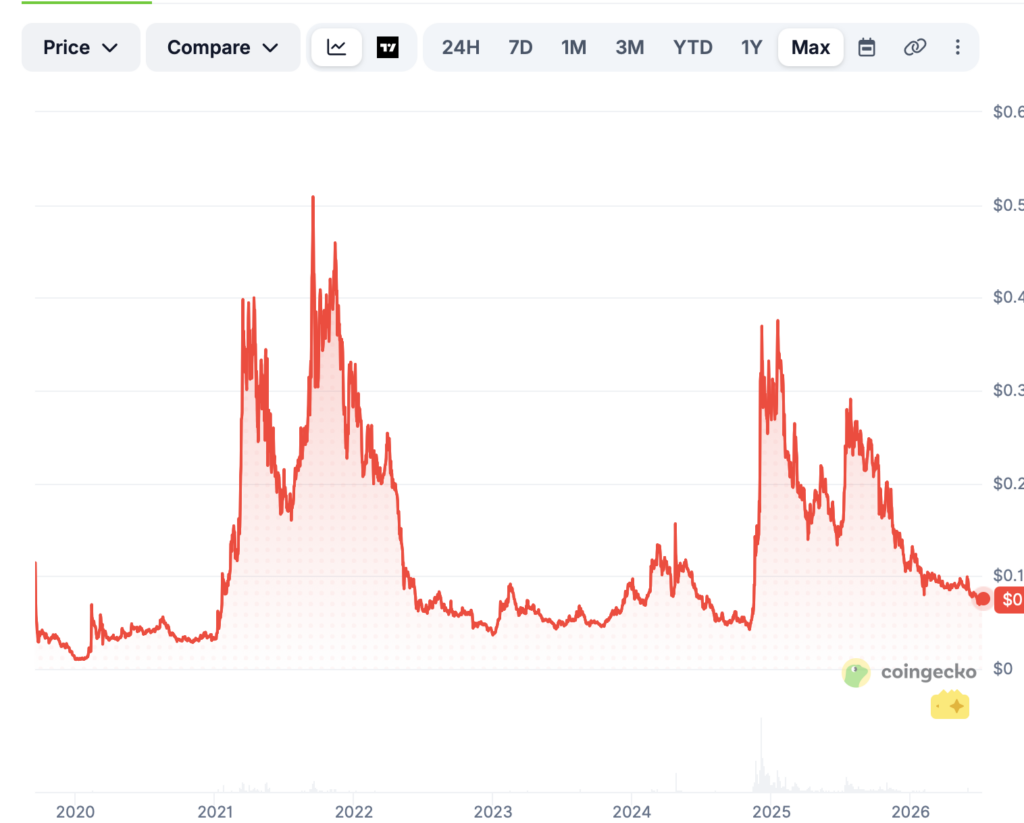
HBAR price history; Source: Coingecko
- In 2019, HBAR started at a negligible value, fluctuated, and ended the year near $0.01.
- HBAR opened 2021 at $0.03 and rose to $0.10 by early February due to active network developments.
- In 2024, HBAR peaked at $0.1793 in April, dropped to $0.051 by September, then rebounded to $0.30 in December, closing the year around $0.29.
- In January 2025, trading was stable between $0.30 and $0.31, ending at $0.30.
- In February, HBAR dipped to the $0.25–$0.26 range, then declined further in March to around $0.20.
- As of June, HBAR trades between $0.17 and $0.18 after closing May at $0.1874.
- HBAR ended June at $0.147. At the start of July, HBAR has increased, and it currently trades at $0.16
- HBAR declined from approximately $0.25 on July 31 to about $0.23 on August 2, 2025.
- The price rebounded slightly to around $0.24 by August 3, 2025.
- From August to September 6, HBAR showed steady growth, climbing from around $0.065 to nearly $0.095 as investor optimism rose following new enterprise partnerships and increased network activity.
- From September 6 to now, HBAR traded mostly between $0.075 and $0.10. This was because buying slowed down after earlier gains, and investors were waiting for clearer signals from the market as a whole.
- Here are five key price-history snapshots for Hedera (HBAR) from early October to early November 2025:
- On October 4, the price closed around $0.2171 after opening near $0.2256.
- By October 1,0 HBAR had plunged to approximately $0.1644, marking a notable drop from the start of the month.
- Between October 15 and 17, the token hovered in the $0.165–$0.190 range, with October 17 closing around $0.1625.
- In late October (October 21–26), HBAR ranged between roughly $0.1705 and $0.1726, showing relative stability.
- By November 3, HBAR had traded in the $0.170–$0.185 range, indicating a modest recovery from the October lows.
- Early November: HBAR traded around $0.072–$0.075, with mild upward volatility, briefly testing $0.078 before losing momentum.
- Mid-November: The price trended downward to the $0.060–$0.065 range amid broader market weakness and low liquidity. HBAR briefly dipped near $0.058 around Nov 20–22.
- Late November to Dec 7: HBAR consolidated tightly between $0.058 and $0.063, showing low volatility and weak recovery signals, hovering around $0.060–$0.061 in early December.
- Around Dec 5, 2025, HBAR was ~$0.1339 and then traded lower into late December, with prices near ~$0.1117 by Dec 31, 2025, showing a mild downward trend as the month progressed
- In early January 2026, HBAR rose modestly from about $0.1063 on Jan 1, 2026, to roughly $0.1288 by Jan 6, 2026, indicating a short rebound after the December lows
- Hedera (HBAR) traded between $0.083 and $0.079 from Jan 6 to late January 2026, then gradually declined to the $0.070-$0.068 range as bearish momentum intensified.
- From early February to Mar 16, 2026, HBAR continued trending lower, briefly stabilizing near $0.066 before fluctuating between $0.062 and $0.065 as the market entered a consolidation phase.
- HBAR entered May 3 trading around $0.087, having spent months compressed in the tight $0.085 to $0.095 range, before spiking to a May high of $0.116 driven by Canary Capital ETF inflows and Hedera’s integration with the U.S. insurance market, before fully retracing back toward $0.088 by month’s end.
- By June 3, HBAR was trading around $0.095 to $0.114, showing signs of gradual recovery as the CLARITY Act, which was progressing toward a Senate floor vote, positioned HBAR as a prime beneficiary of regulatory clarity alongside XRP and XLM, with analysts citing the bill as a pivotal catalyst for institutional adoption.
- HBAR opened June 2026 near $0.090, then suffered a brutal month-long collapse driven by zero ETF inflows from the Canary HBAR ETF, extreme fear sentiment, and broad crypto market weakness — crashing to a 2026 low of $0.0696 by late June, erasing the entire May recovery from the $0.110 spike.
- By July 6, HBAR has recovered modestly to approximately $0.079, bouncing from the $0.069 lows, as analysts highlighted HBAR’s enterprise partnerships and hashgraph technology as long-term strengths. Sentiment remains deeply cautious, with only 13% bullish market signals and the Fear & Greed Index still at extreme fear levels.
- HBAR traded in the $0.065–$0.074 range, moving sideways within a descending channel while holding above key support near $0.0653, tracking modest broader-market tailwinds.
- HBAR continued consolidating between $0.068–$0.070, still trapped in that descending channel since May with support at $0.065, showing little net movement despite steady enterprise-adoption news (Asseto Access tokenization platform) and only modest ETF inflows.
Por:


Faça login para responder
Faça login para compartilhar sua opiniãoComentários
Artigos relacionados