Bitcoin plonge à 108 000 $, chutant de 3,6 % en 24 heures et près de 7 % sur la semaine

Bitcoin essuie une correction technique alors que les traders prennent leurs bénéfices après la récente envolée.
Analyse du mouvement
Le roi des cryptomonnaies subit une pression vendeuse qui rappelle aux investisseurs la volatilité intrinsèque des actifs numériques. Les 3,6 % perdus en une journée s'ajoutent à une baisse hebdomadaire approchant les 7 % - un rappel que même les actifs les plus bullisés connaissent des phases de consolidation.Perspective marché
Les volumes restent élevés sur les plateformes d'échange, signe que l'intérêt institutionnel persiste malgré ce repli. Les fondamentaux du Bitcoin - rareté programmée et adoption croissante - restent inchangés. Les baisses comme celle-ci offrent souvent des points d'entrée stratégiques pour les investisseurs à long terme.Réalité financière
Parfois, même les actifs les plus prometteurs doivent respirer - contrairement aux banques traditionnelles qui semblent parfois préférer l'apnée. Cette correction saine permet au marché de repartir sur des bases plus solides, loin de la surchauffe des sommets récents.Long-term holders dumped Bitcoin while ETFs went silent
Bitcoin’s latest rally, which hit a post-FOMC high of $117,000, has reversed into what analysts describe as a classic “buy the rumour, sell the news” pattern. Glassnode analysts said Thursday that bitcoin is now “showing signs of exhaustion” as ETF demand stalled and long-term investors began locking in profits.
The current drop, from $124,000 down to $113,700, equals an 8% decline. That’s mild compared to this cycle’s 28% drawdown or the 60% drops seen in previous ones. But analysts also noted that Bitcoin’s volatility has been shrinking over time, now resembling the slow climb seen between 2015 and 2017. There’s been no blow-off top yet.
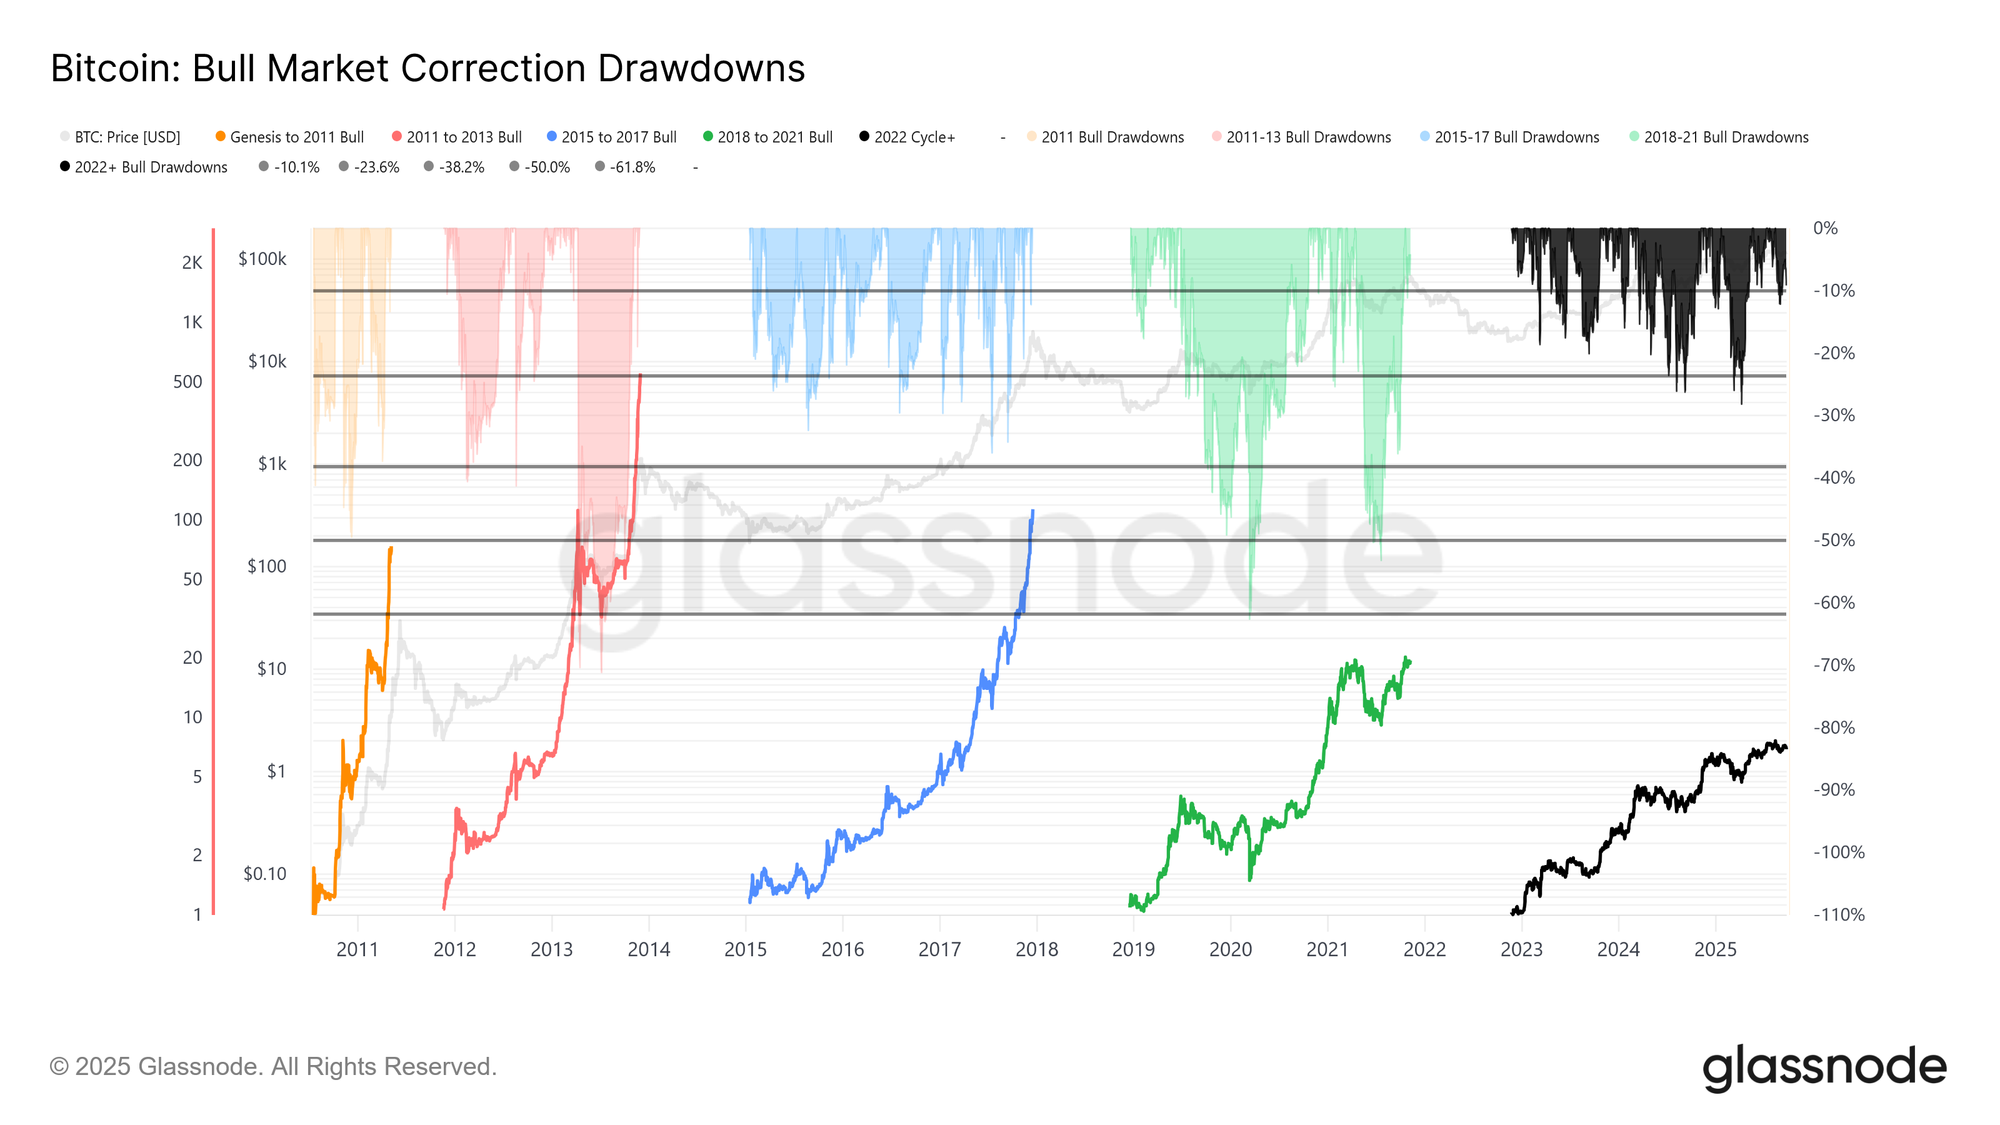
This cycle has lasted around 1,030 days, just shy of the 1,060-day duration seen in the last two. On-chain data shows capital deployment has moved in three WAVES since November 2022, lifting Realized Cap to $1.06 trillion. Capital inflows are now at $678 billion, nearly twice the last cycle’s $383 billion.
This wave didn’t come all at once. Each time over 90% of moved coins were in profit, that signaled a top. The crypto just backed away from its third such spike. Long-term holders have sold 3.4 million BTC, already more than they did in past cycles.
ETF flows, which helped soak up that supply earlier in the year, fell off a cliff. Around the FOMC, long-term holders were unloading at a rate of 122,000 btc per month, while ETF net inflows dropped from 2,600 BTC/day to nearly zero. That created a weak environment, as selling pressure rose and new demand dried up.
Futures and options exposed the market’s fragility
Spot markets cracked first. As Bitcoin dropped, trading volume exploded, and thin order books couldn’t handle the flow. That pushed the price under $113,000 and triggered a sharp flush in futures. Open interest dropped from $44.8 billion to $42.7 billion, forcing over-leveraged traders to exit and magnifying the fall.
Heatmaps from Coinglass showed major liquidation clusters between $114,000 and $112,000, clearing out leveraged longs. That created a short-term floor near $111,800, where the short-term holder’s cost basis now sits.
But price remains unstable. Risk levels still hover around $117,000, and without stronger buying, prices could swing even more. In the options market, volatility surged before the FOMC and then cooled once the rate cut was confirmed.
That didn’t last. A Sunday futures crash reignited the fear trade. One-week implied volatility jumped, and pressure spread to longer contracts. On Friday, 1W skew spiked from 1.5% to 17%, showing that traders scrambled for downside protection.
That rush was real. Two days later, the biggest liquidation since 2021 hit the market. The put/call volume ratio dropped after that, as traders cashed out their puts and moved to cheaper calls. Still, Skew data shows the market is still tilted toward more puts, keeping protection expensive and upside cheap.
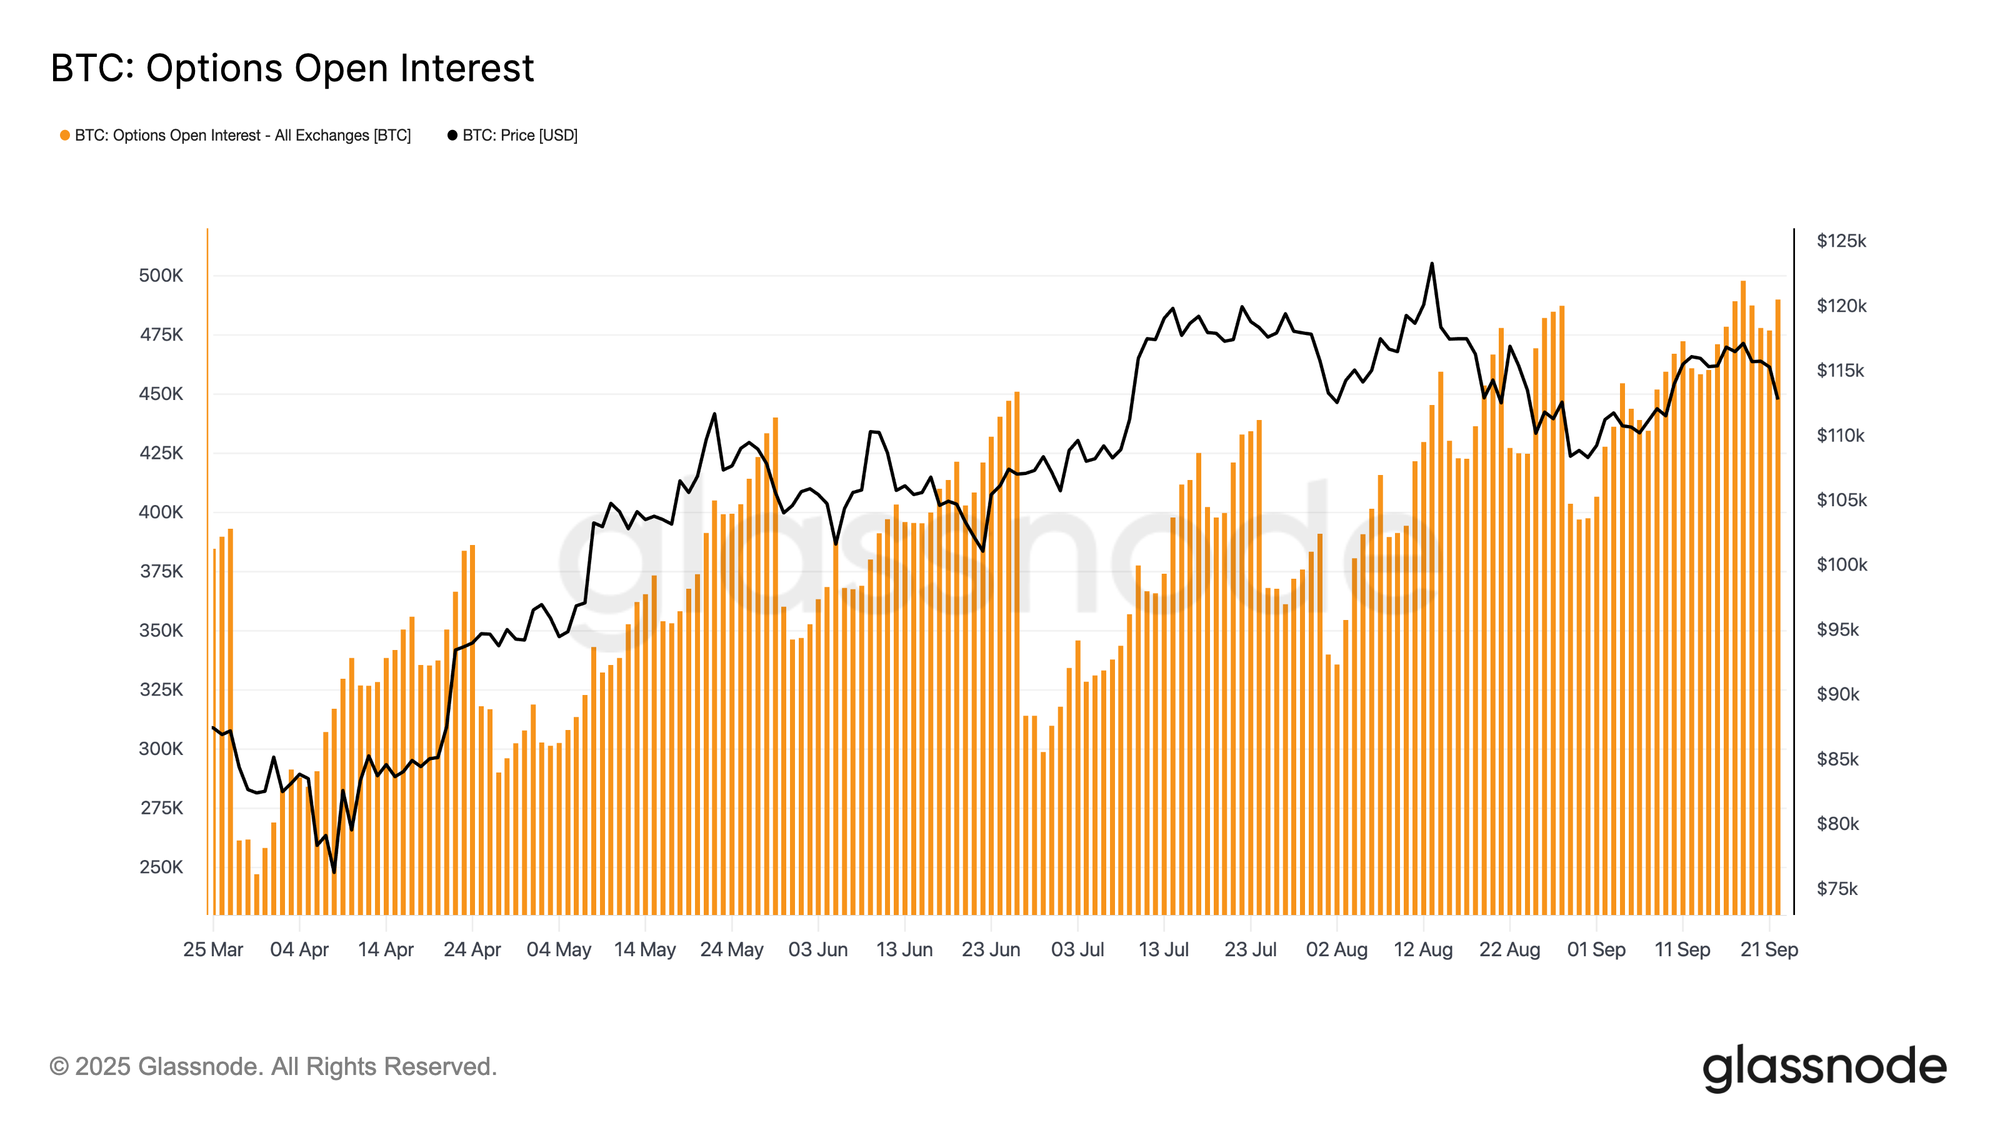
Total options open interest is still near record highs. Most of that will reset after Friday morning’s expiry. Until then, dealers are pinned in a peak gamma zone, forced to hedge every tiny move.
KEY Difference Wire: the secret tool crypto projects use to get guaranteed media coverage
