Bitcoin Plunge to $92K Inevitable? Decoding the Ominous Historical Pattern

Bitcoin's price rollercoaster might be gearing up for its wildest drop yet—if history repeats itself. Brace for impact.
Here's why traders are sweating over their cold wallets.
The $92K prophecy: When charts whisper, markets scream. Past cycles suggest Bitcoin's next nosedive could slash valuations by 40% or more—because apparently, even decentralized money loves a good callback.
Meanwhile, Wall Street 'experts' will blame everything except their own flawed models. Classic.
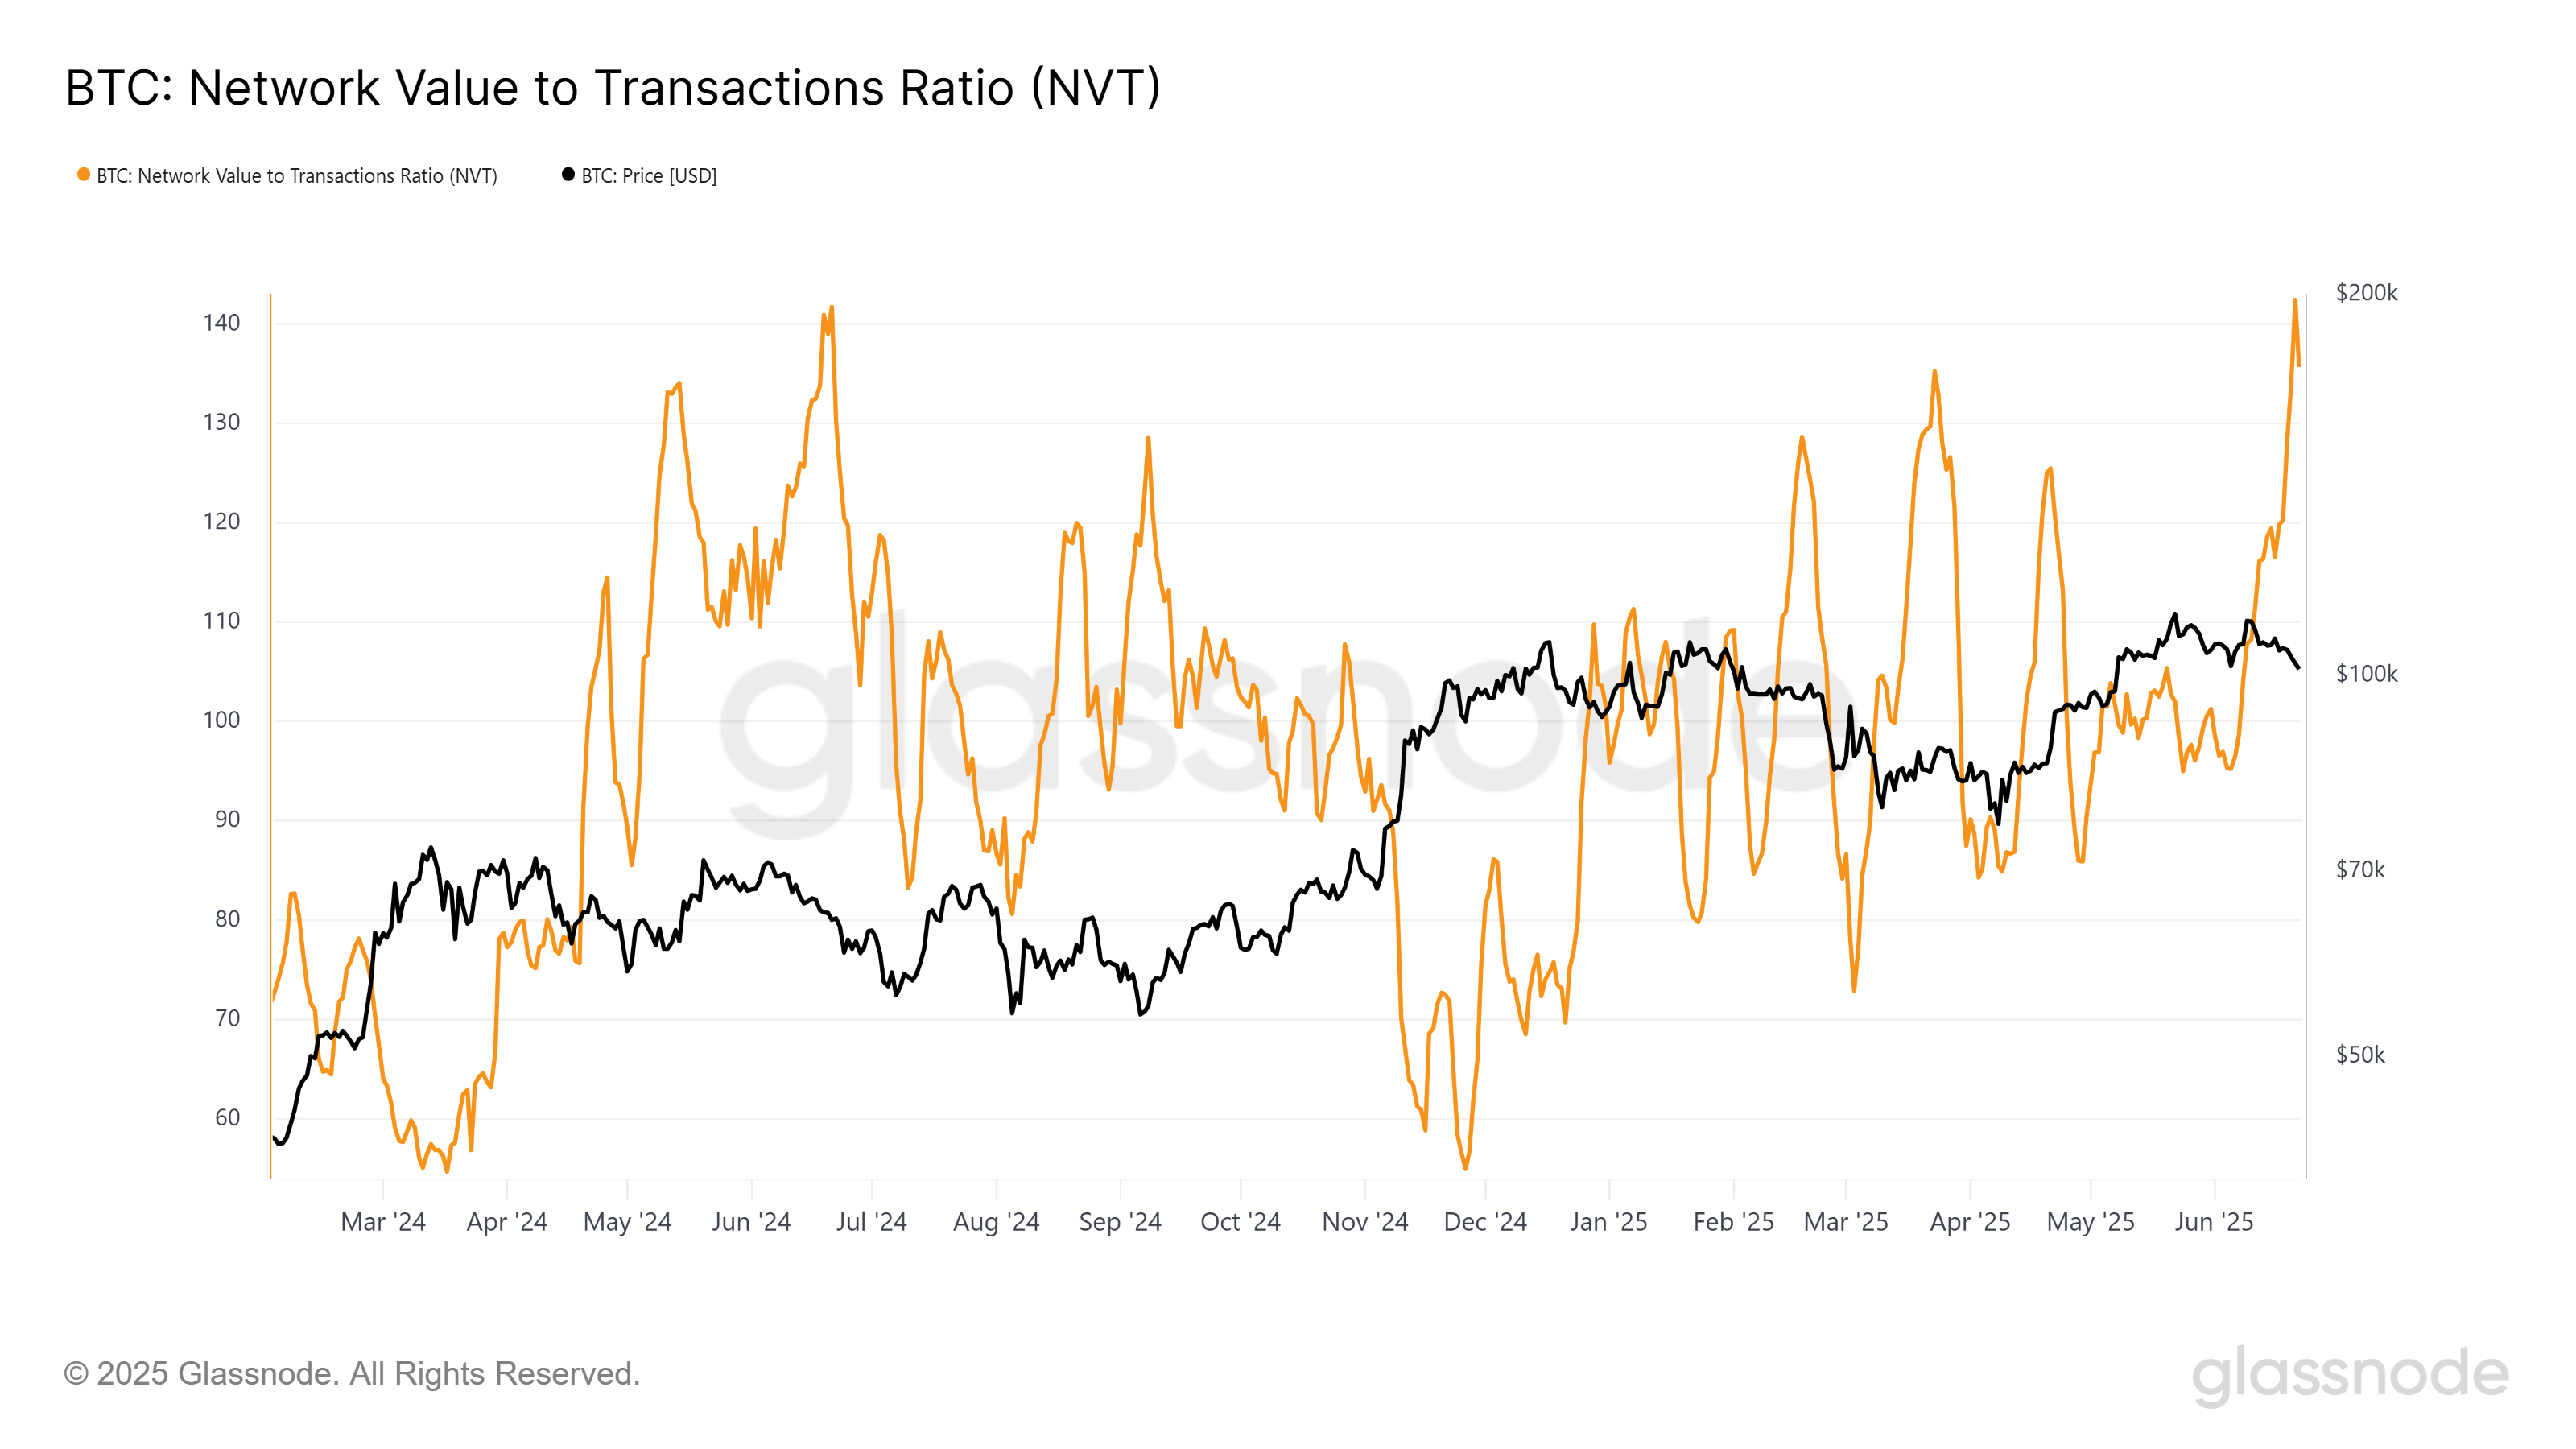
Bitcoin Is Overbought
The Network Value to Transactions (NVT) Ratio for bitcoin is currently at its highest level in a year, signaling that the network valuation is far exceeding the transaction activity. Historically, such a spike in the NVT ratio has often acted as a precursor to a market correction.
This suggests that Bitcoin may be overvalued, leading to a potential cooldown in the price. While a slight decline in the NVT ratio was observed this past weekend, it was largely attributed to external factors and did not change the broader trend.
Bitcoin remains vulnerable as an overbought asset, and historical patterns show that after such a buildup, a correction is often inevitable.
Moreover, the Bitcoin liquidation map indicates that more than $1.17 billion worth of long liquidations could occur if Bitcoin’s price falls to $92,000. This potential liquidation spike suggests a significant risk for those holding long positions.
Despite the positive funding rate, which has encouraged Optimism in some quarters, the liquidation map shows that Bitcoin could face significant downward pressure if it hits the $92,000 mark. This suggests that the bearish trend is not yet over, and Bitcoin may struggle to maintain its price above key support levels.

BTC Price Is Vulnerable To Losses
Bitcoin is currently forming a double-top pattern, also known as the inverse W pattern. This pattern is typically considered a bearish signal and suggests that if validated, Bitcoin could face a correction. The formation of this pattern over the past two months highlights increasing selling pressure, which could lead to a further price decline.
The pattern is currently holding above $100,000, but a decline below this crucial level would confirm the bearish setup. If Bitcoin price breaks below $98,000, it would likely target a crash to $92,000, representing a 9% drop. This would trigger further selling, reinforcing the bearish outlook for Bitcoin in the short term.
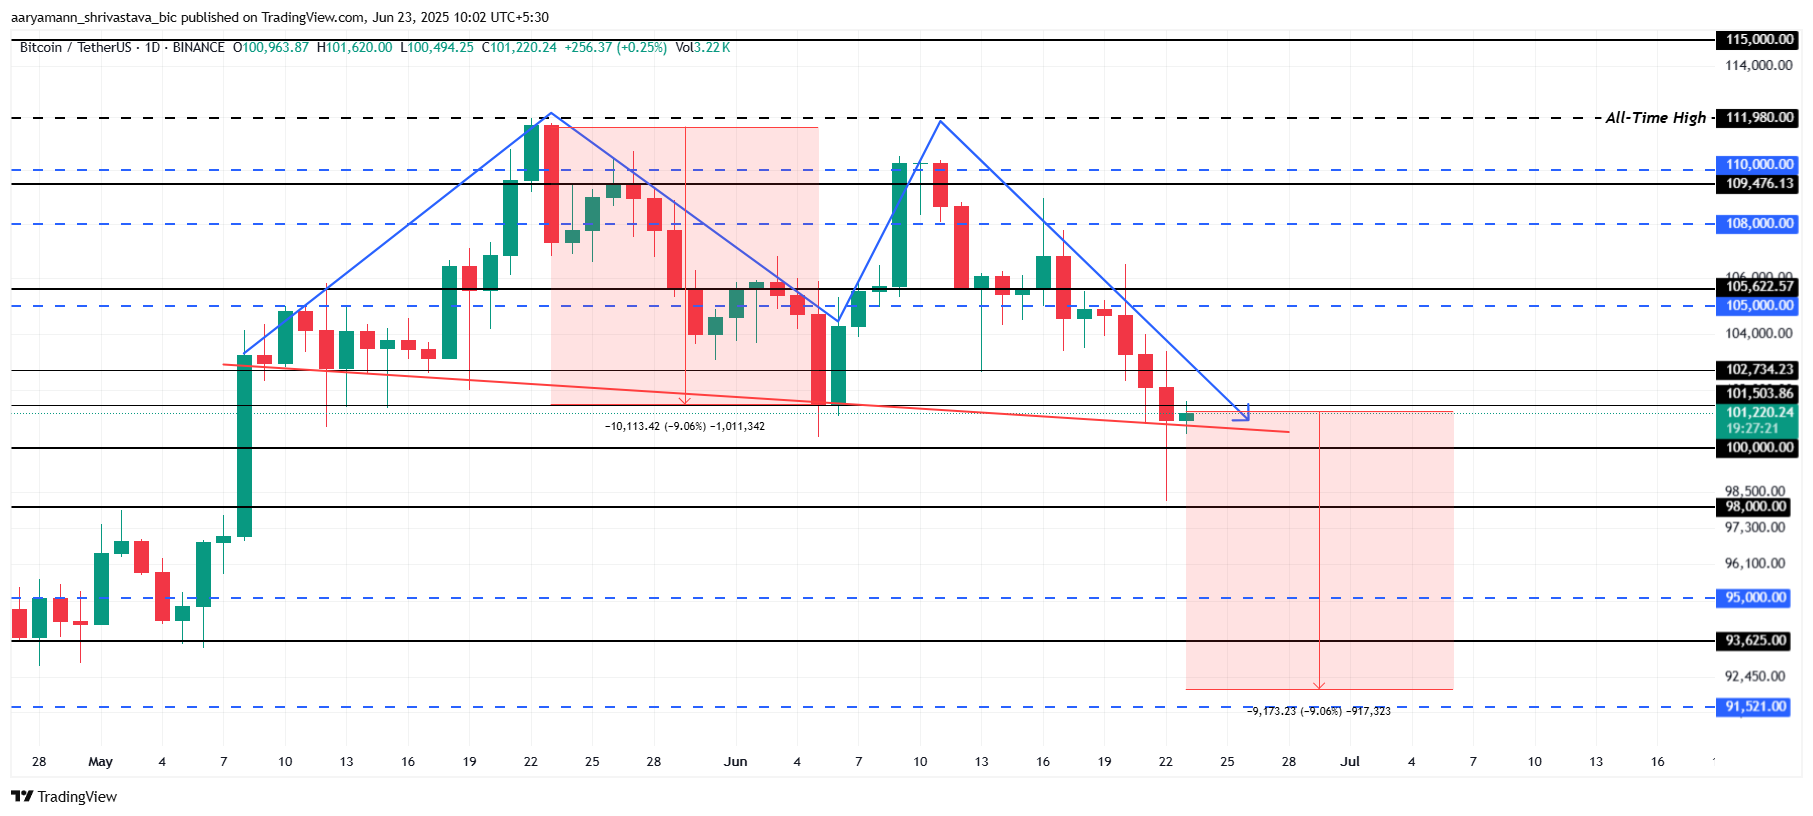
However, if broader market conditions improve and Bitcoin manages to hold above the $100,000 support level, it could rebound. A recovery that sees Bitcoin flip the $102,734 resistance into support WOULD shift momentum back toward the bullish side. This could potentially drive Bitcoin’s price up to $105,000, invalidating the current bearish thesis.

Log in to Reply
Log in to comment your thoughtsComments
Related Articles
|Square
Get the BTCC app to start your crypto journey
Get started today Scan to join our 100M+ users