Solana (SOL) at a Crossroads: Can It Defy Gravity and Stay Above $130 Before Q2 Closes?

Solana's SOL is dancing on a knife's edge—will the $130 support hold or crumble as Q2 races to a close?
The high-speed blockchain's token has traders glued to their screens, watching for the next big move. With institutional interest surging and retail FOMO creeping back in, SOL's price action is anything but boring.
Technical traders are eyeing key levels while fundamentalists debate network upgrades. Meanwhile, Wall Street 'experts' who called crypto dead last year are suddenly rediscovering their crystal balls.
One thing's certain: In crypto, the only guarantee is volatility—and the occasional rug pull masquerading as innovation.
SOL Slips as Key Indicators Remain Bearish
Over the past seven days, SOL’s price has steadily declined. This has been accompanied by a dip in the coin’s Chaikin Money FLOW (CMF), which has fallen deeper into negative territory. As of this writing, SOL’s CMF is at -0.13.
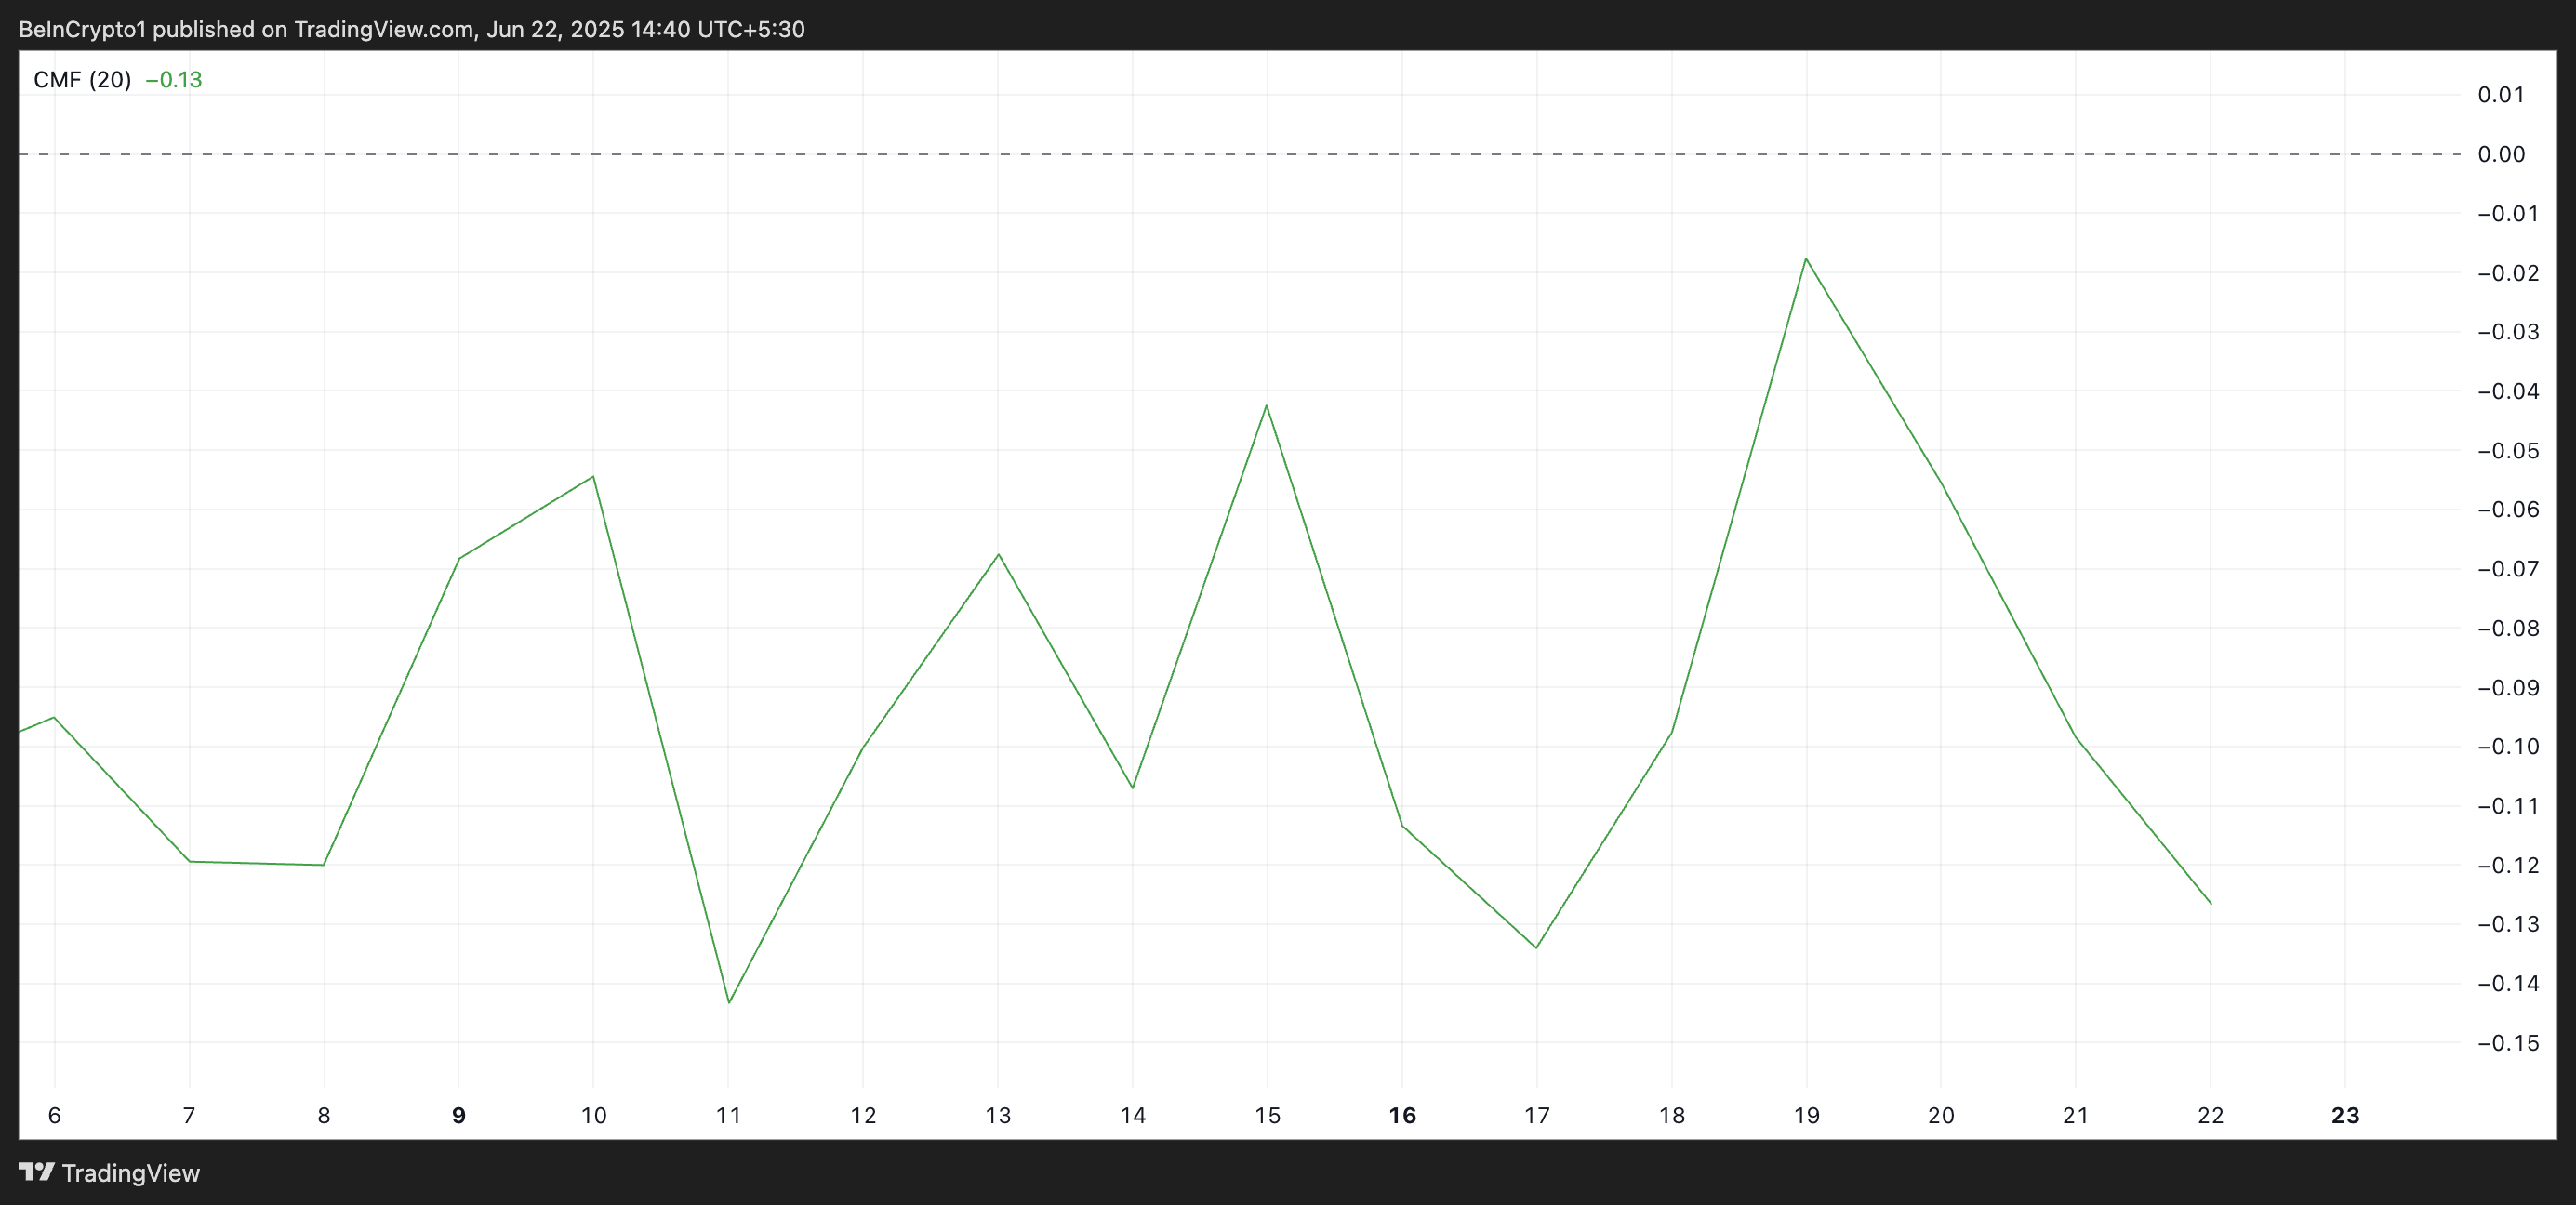
The CMF measures the Flow of money into and out of an asset over a specific period, typically 20 or 21 days. It combines price and volume data to assess buying and selling pressure. When an asset’s CMF is positive, buying volume is dominant and capital is flowing into the asset, indicating potential bullish sentiment.
Conversely, when the CMF turns negative, selling volume outweighs buying volume, meaning money flows out. This signals weakening demand for SOL, especially if the negative reading deepens while price declines.
Moreover, the coin’s Elder-Ray Index, which gauges the balance between buyers and sellers, is at -20.74, signifying that sellers are firmly in control.
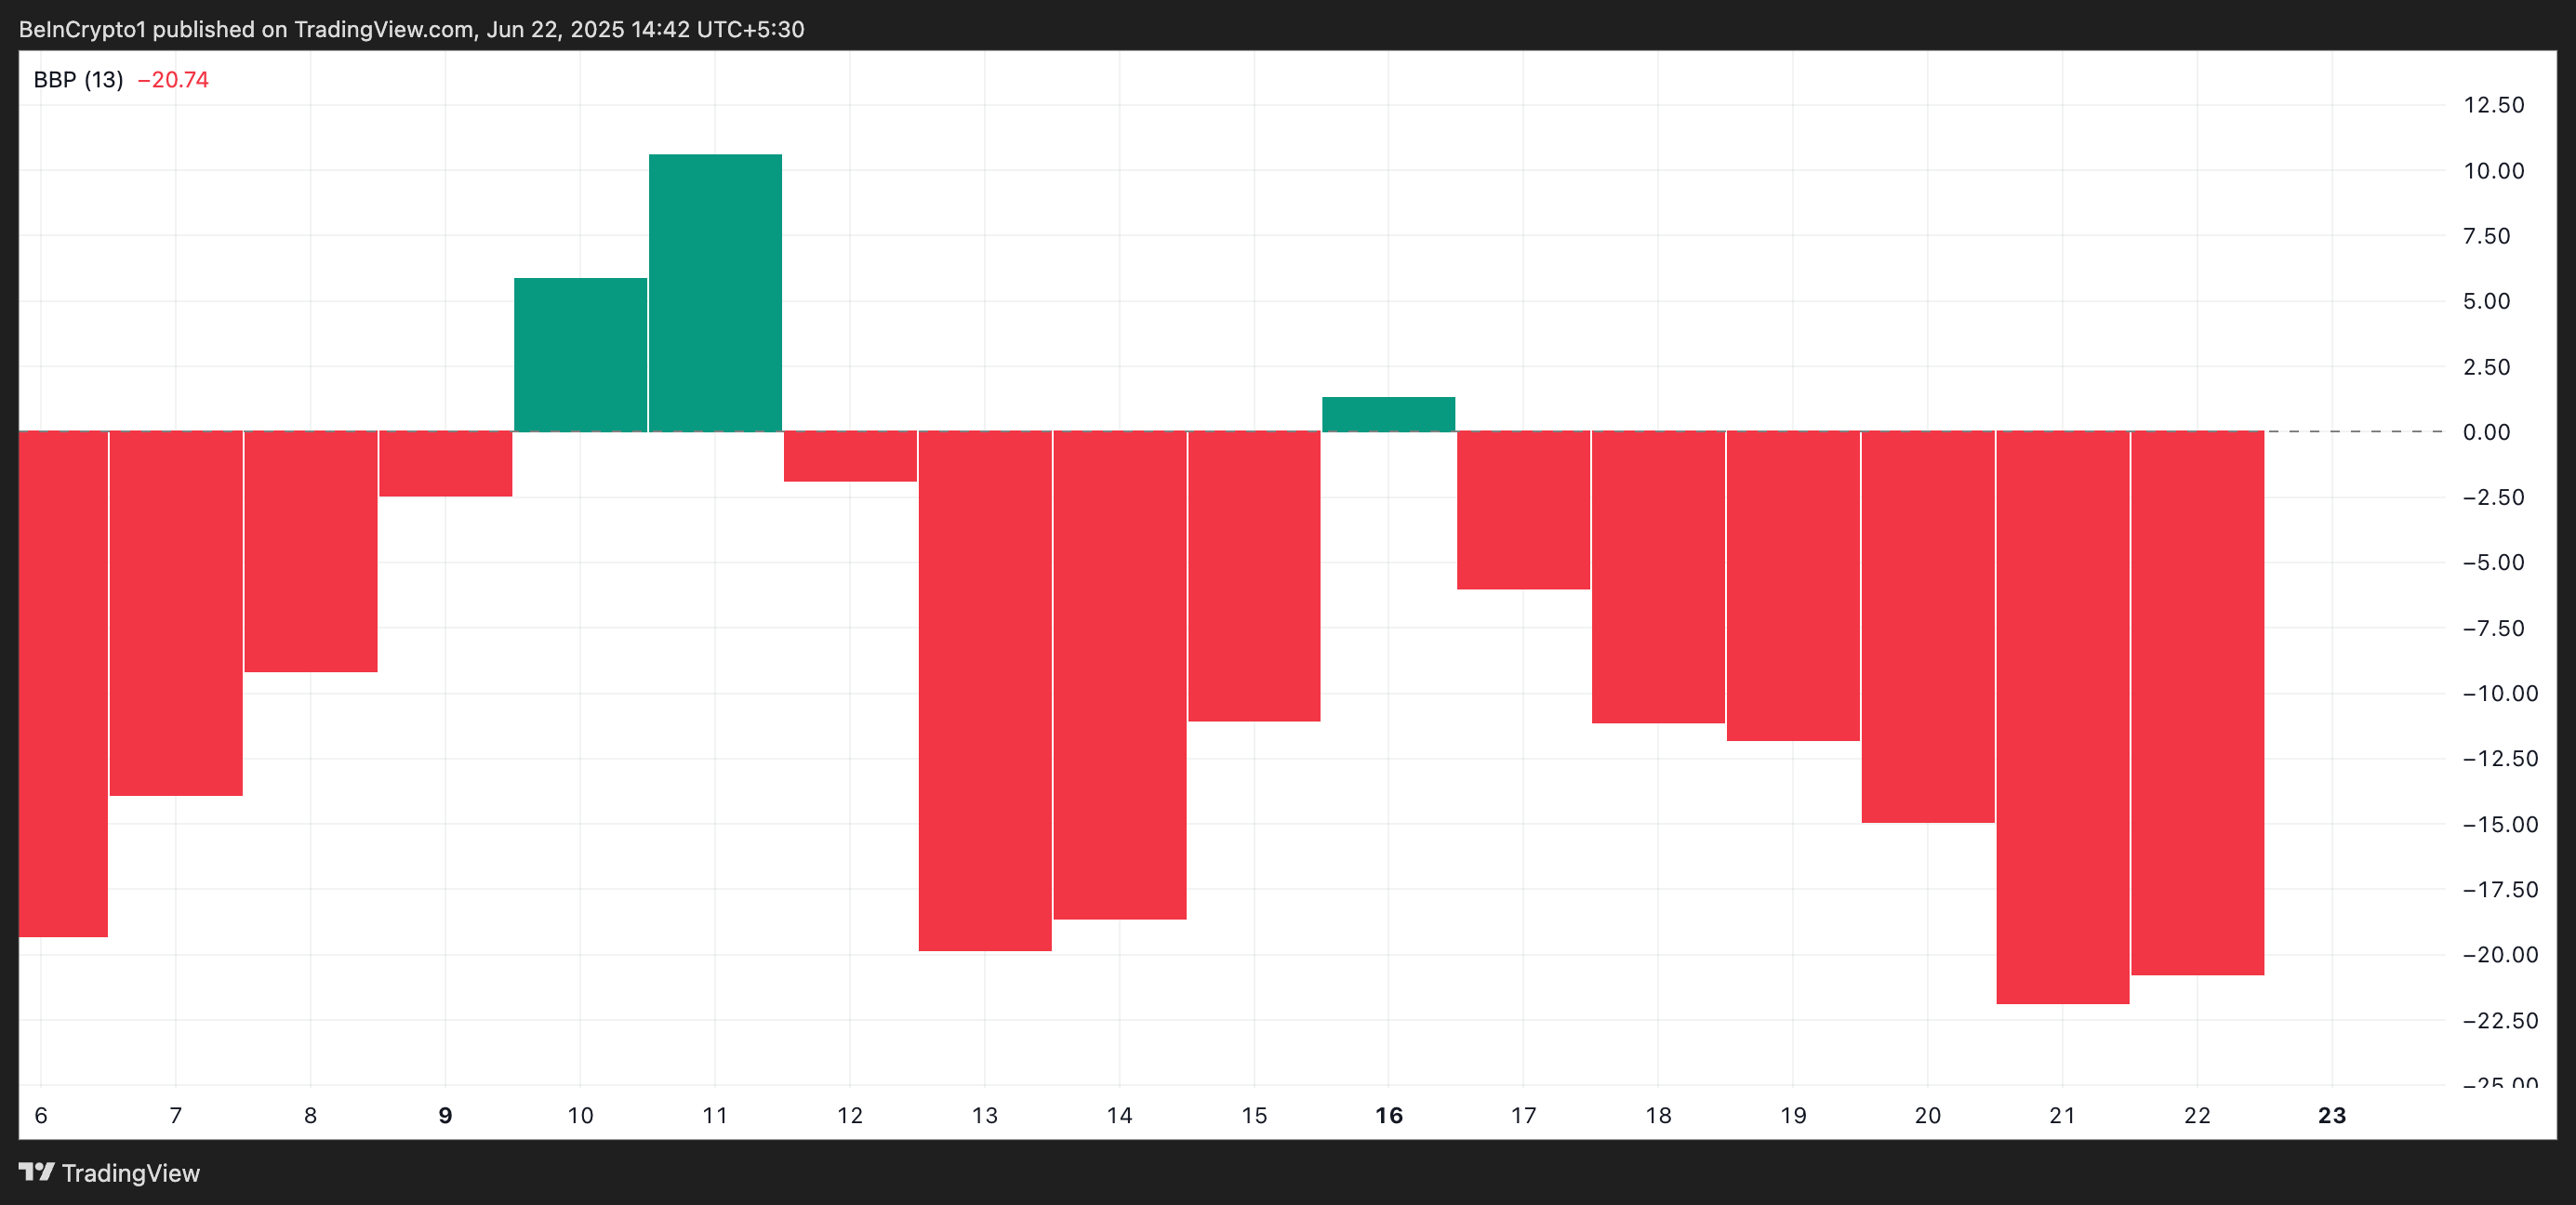
This indicator measures the strength of bulls and bears in the market by analyzing the difference between an asset’s price and a moving average. When it is negative, bears dominate, as prices consistently fall below the average, suggesting selling pressure outweighs buying interest.
Will SOL Recover Above $130 or Is a Drop to $123 Looming?
This bear dominance reflects the growing conviction that SOL’s price could decline further, particularly if $134 fails to hold as a support floor.
Meanwhile, a breakdown below this level could open the door for deeper losses, potentially dragging SOL toward $123.49.
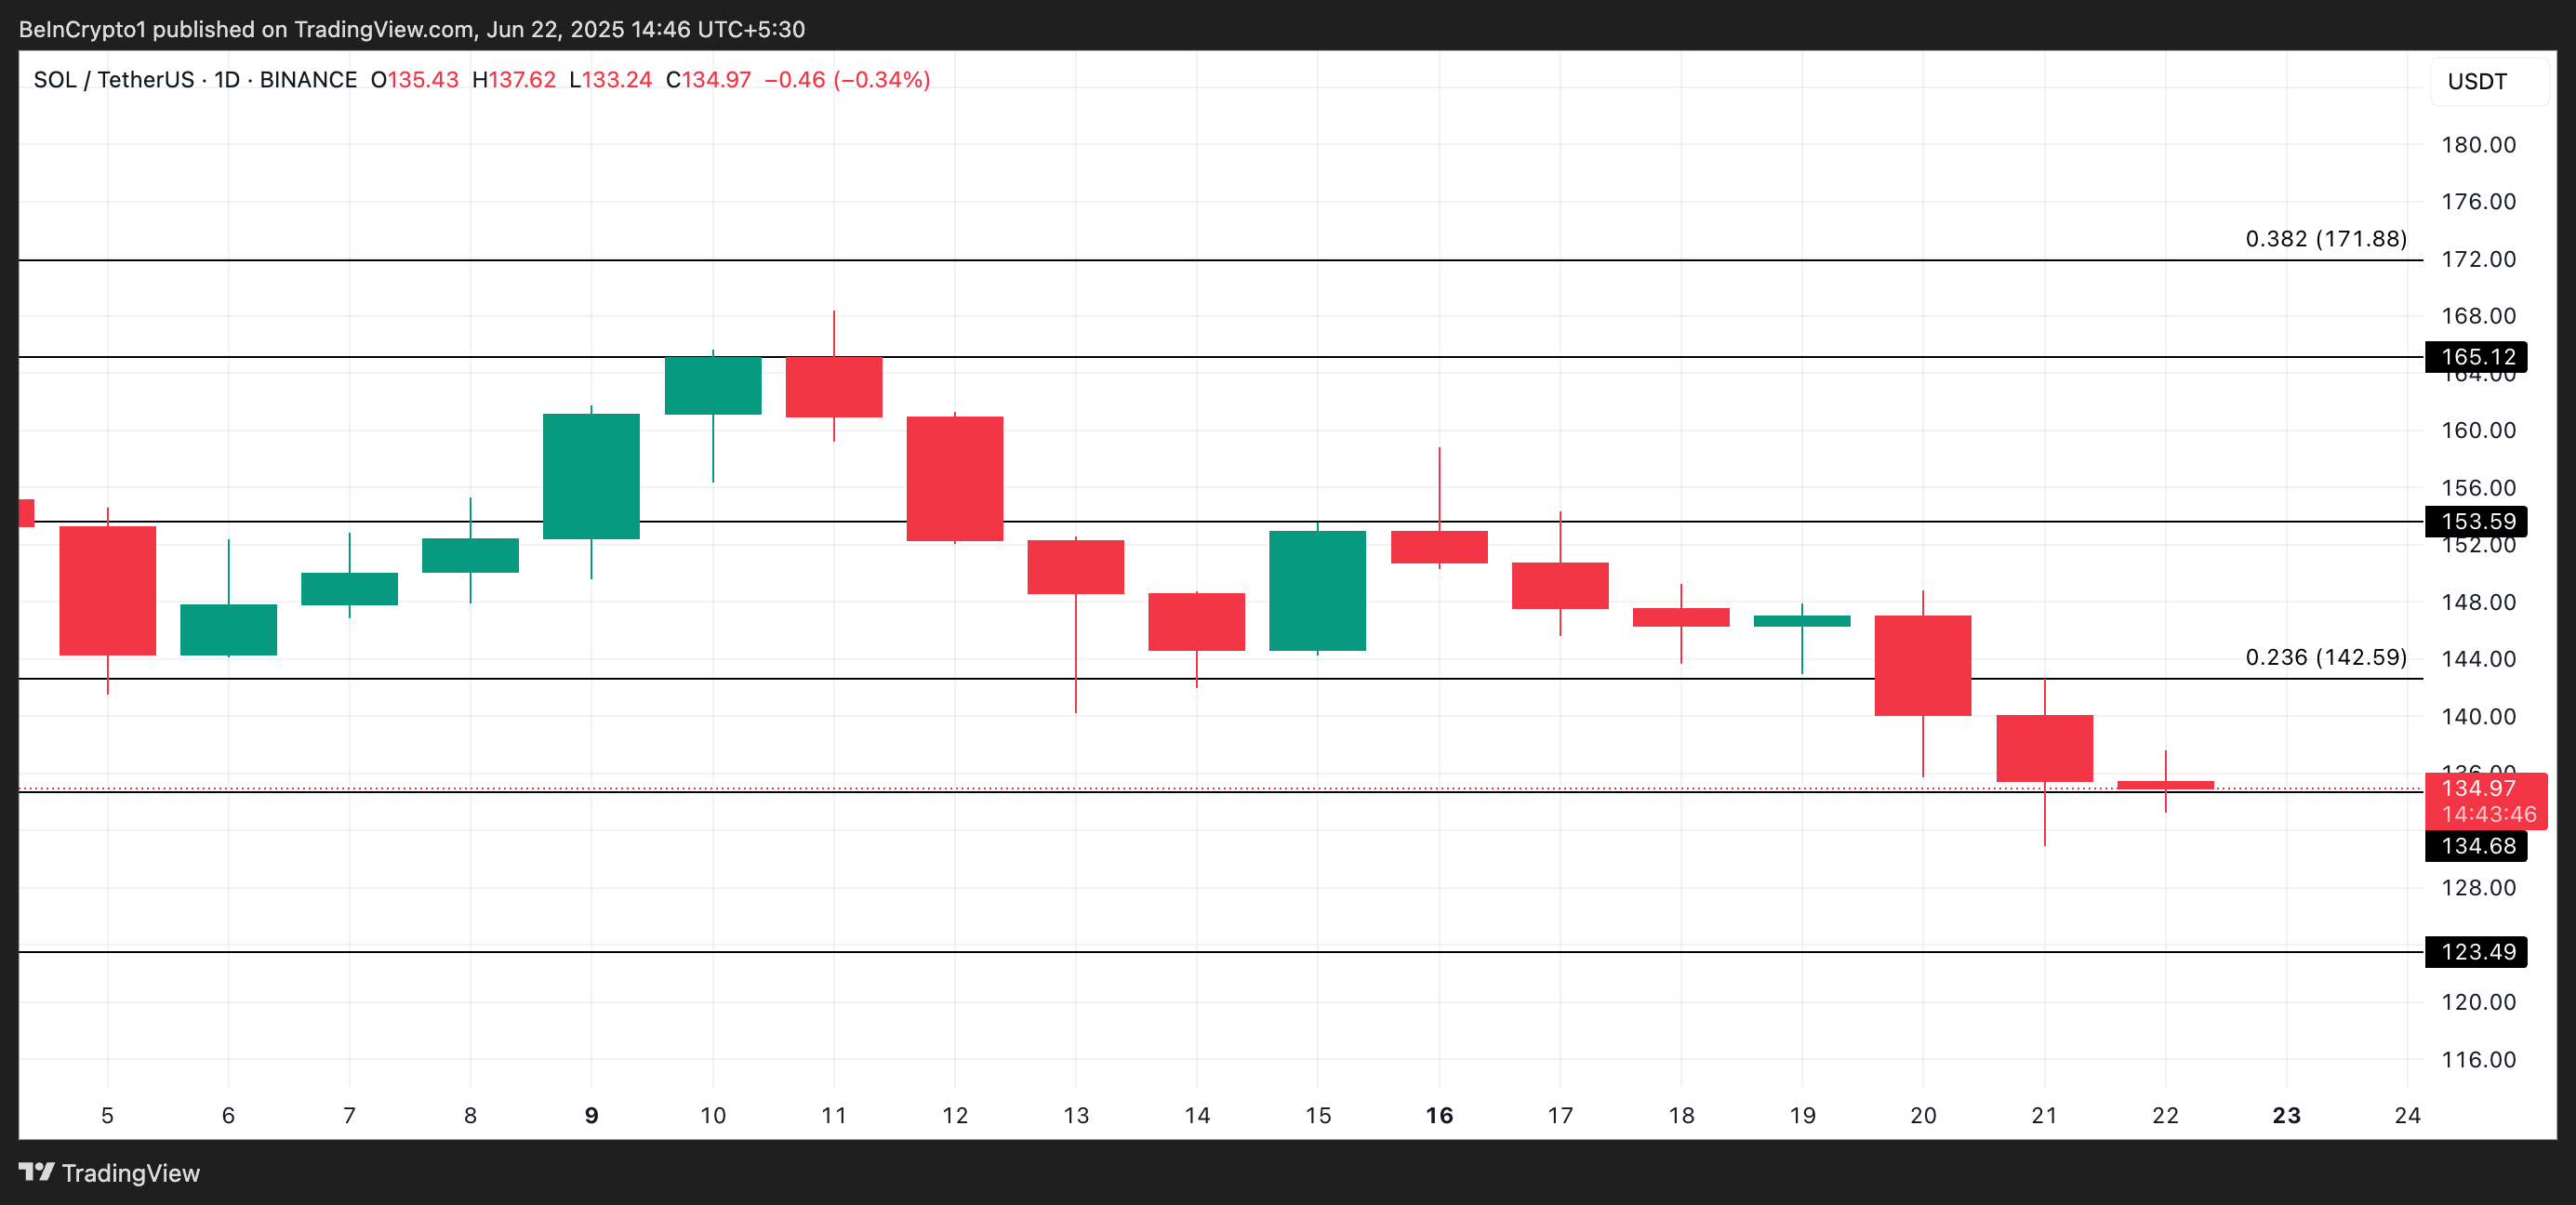
However, if bulls manage to regain control, they could push Solana’s price upward to $142.59.

Log in to Reply
Log in to comment your thoughtsComments
Related Articles
|Square
Get the BTCC app to start your crypto journey
Get started today Scan to join our 100M+ users