Jupiter’s [JUP] price action is ‘stuck’ – When will the market trend change?

- Jupiter seemed to have a bullish structure on the lower timeframes, but may lack a trend on the daily chart
- Liquidation heatmaps were in line with the observed range formations
The buyback plan that Jupiter [JUP] announced was followed by a 12.2% price surge on Friday. This news is expected to have a further positive impact on demand for JUP and the platform’s usage.
Despite the surge on Friday, however, the price outlook is not quite firmly bullish in the short to medium term. In the coming weeks, the $1 and $1.3 levels can be expected to pose a significant obstacle to the bulls.
Jupiter swing traders can wait for $1 to be flipped to support

Source: JUP/USDT on TradingView
Since last July, JUP’s price action has revolved around the bullish order block at $0.75 (highlighted in cyan). To the north, the $1.3 resistance zone has consistently held the JUP bulls at bay.
The Directional Movement Index revealed some periods of strong trends, but these did not break the extremes outlined here. The trading volumes over the past month were much higher than in the preceding months.
And yet, JUP’s price stuck to the $0.75-$1.15 region – A zone which has had key Fibonacci retracement levels. The Awesome Oscillator showed momentum was bearish, but beginning to shift bullishly. Additionally, the DMI did not signal a strong trend in progress at press time either.
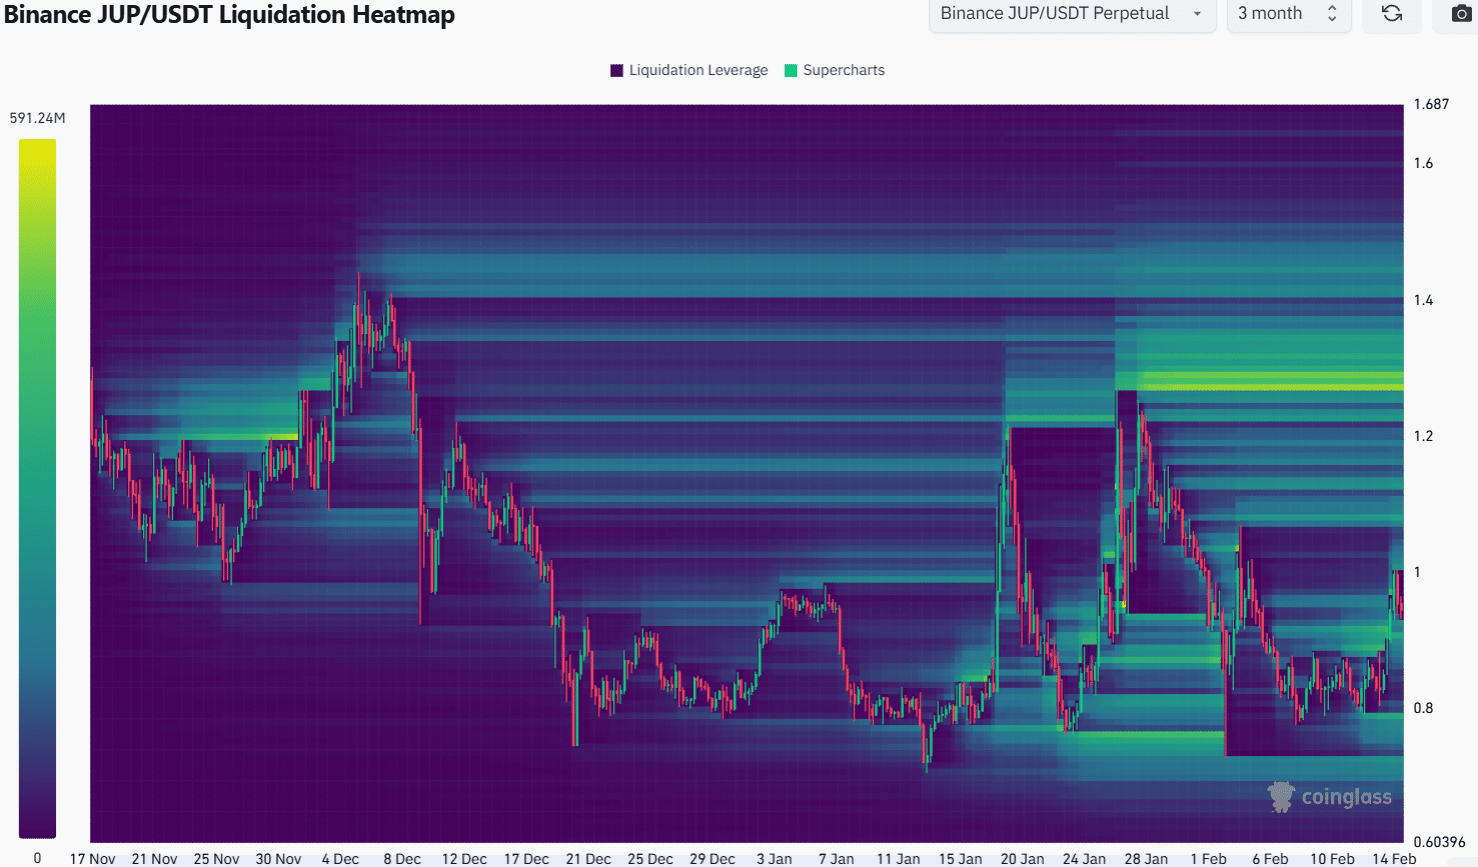
Source: Coinglass
The 3-month liquidation heatmap revealed that the swift drop in early February swept all the key liquidity clusters to the south. Since then, a magnetic zone has formed just under $0.8, but was not an immediate target.
A notable finding is the cluster of liquidations around $1.3. Together, it is proof that Jupiter bulls would likely have a tough time breaking out of the past six months’ range.
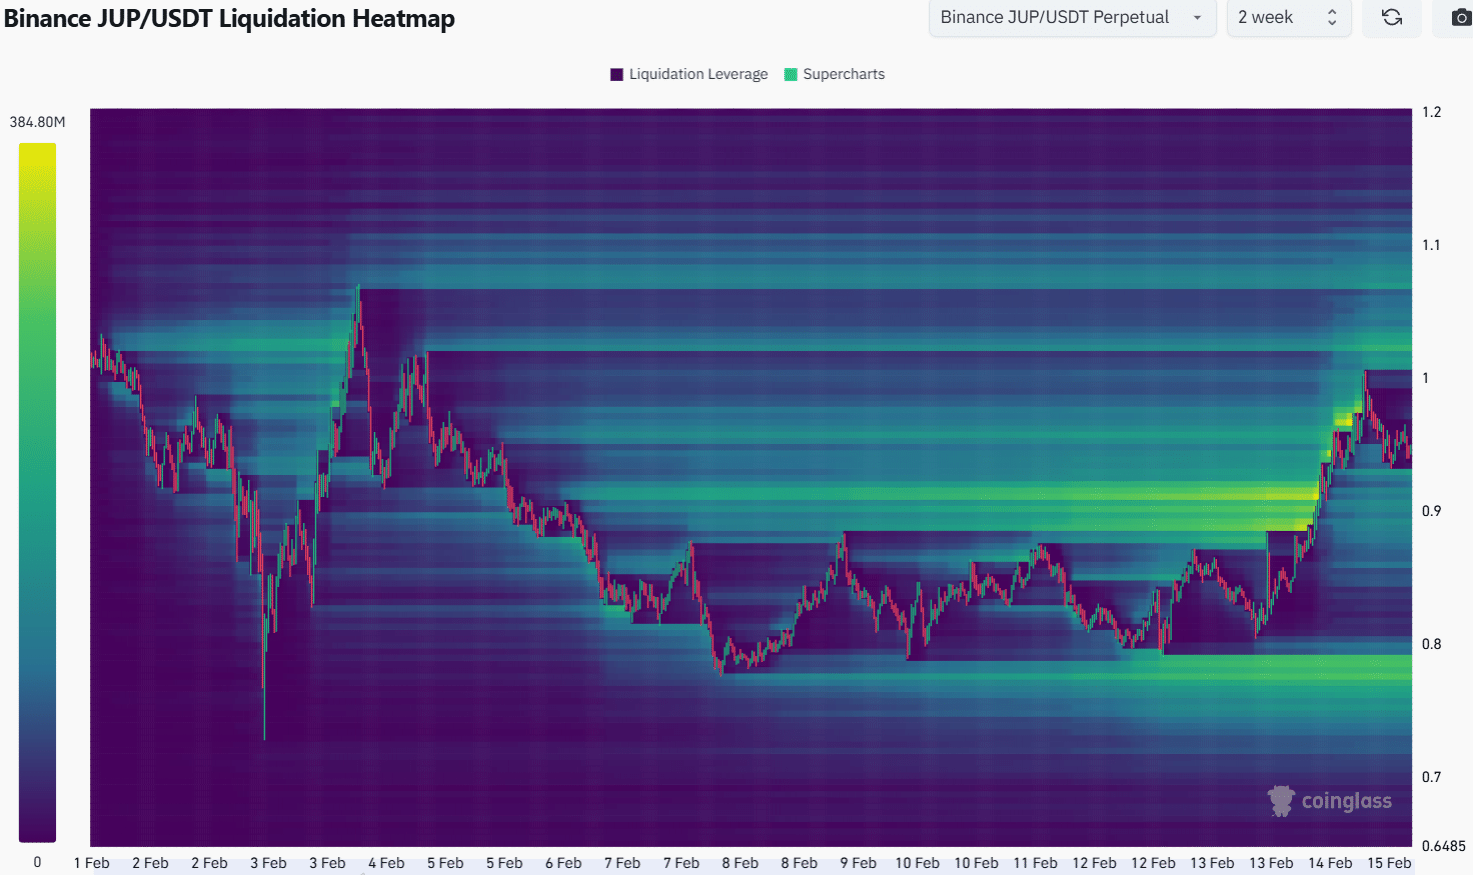
Source: Coinglass
The 2-week liquidation heatmap outlined the presence of liquidation levels around the $1 psychological level. This magnetic zone could attract prices before a bearish reversal. Hence, swing traders should beware a JUP rejection from $1.
Disclaimer: The information presented does not constitute financial, investment, trading, or other types of advice and is solely the writer’s opinion
Take a Survey: Chance to Win $500 USDT

Log in to Reply
Log in to comment your thoughtsComments
Related Articles
|Square
Get the BTCC app to start your crypto journey
Get started today Scan to join our 100M+ users