PI Network Stalls in Sideways Dance — These Make-or-Break Levels Will Decide Its Fate

PI Network's price action has flatlined—traders are eyeing these critical thresholds for the next big move.
The Consolidation Standoff
Like a crypto version of 'Waiting for Godot,' PI's chart shows nothing but indecision. No pumps. No dumps. Just a market napping until something wakes it.
Key Levels to Watch
Break above resistance? Bullish momentum could trigger FOMO buys. Crack below support? Prepare for the usual 'this was always a scam' Twitter meltdown.
The Trader's Dilemma
Risk-reward looks tempting—if you ignore the fact that 99% of 'consolidation patterns' end in disappointment. But hey, someone's got to buy the top.
PI's stuck in purgatory until it picks a direction. Either way, someone's getting rekt—because that's how crypto 'investing' works in 2025.
PI Price Stalls Between $0.47–$0.50
Readings from the PI/USD one-day chart suggest a tug-of-war between bulls and bears since the beginning of the week. The token’s price has remained mostly lackluster, trading within a narrow price range.
Since Tuesday, the altcoin has faced resistance at $0.50 and found support at $0.47. This sideways trend indicates a relative balance between buying and selling pressures, as market participants remain on the sidelines, awaiting a catalyst to trigger movement in either direction.
PI’s flat Relative Strength Index (RSI) confirms this trend. The indicator has remained narrow over the past few days, signaling a period of low volatility and reduced price fluctuation. As of this writing, it is at 35.93.
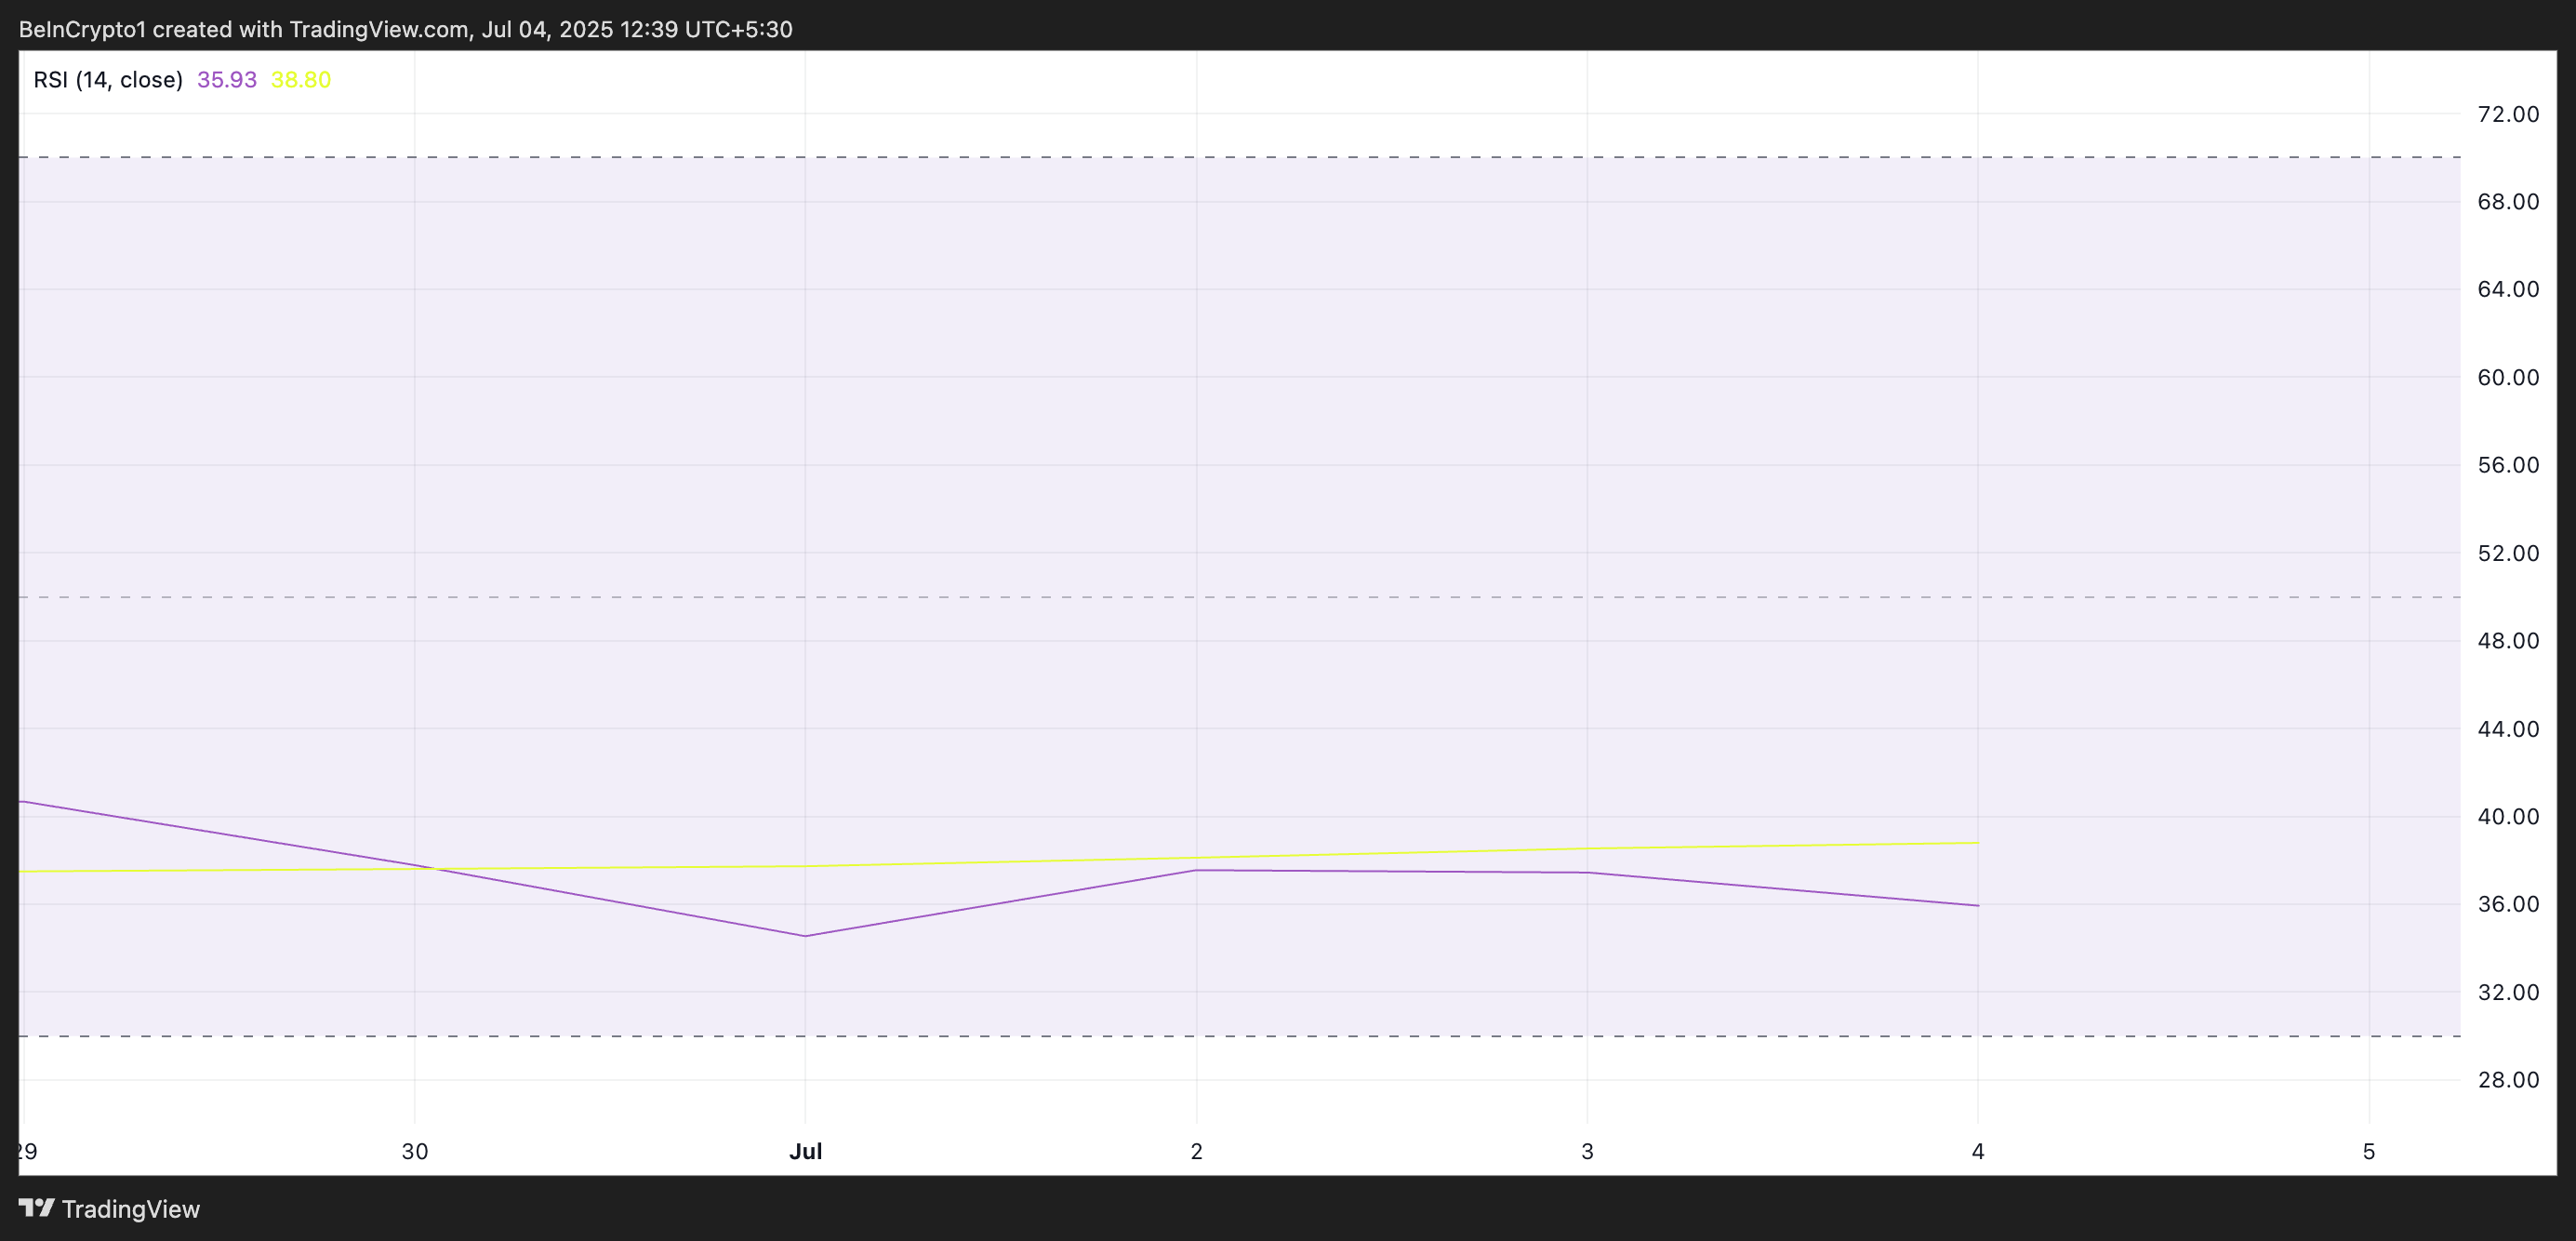
A flat RSI indicates the market lacks strong conviction in either direction. This pattern signals that Pi traders are hesitant to commit to significant buy or sell positions and await a catalyst or trend confirmation.
Furthermore, the token’s plummeting Average True Range (ATR) confirms the steady drop in market volatility. At press time, it was at 0.048, noting a 12% decline since Tuesday.
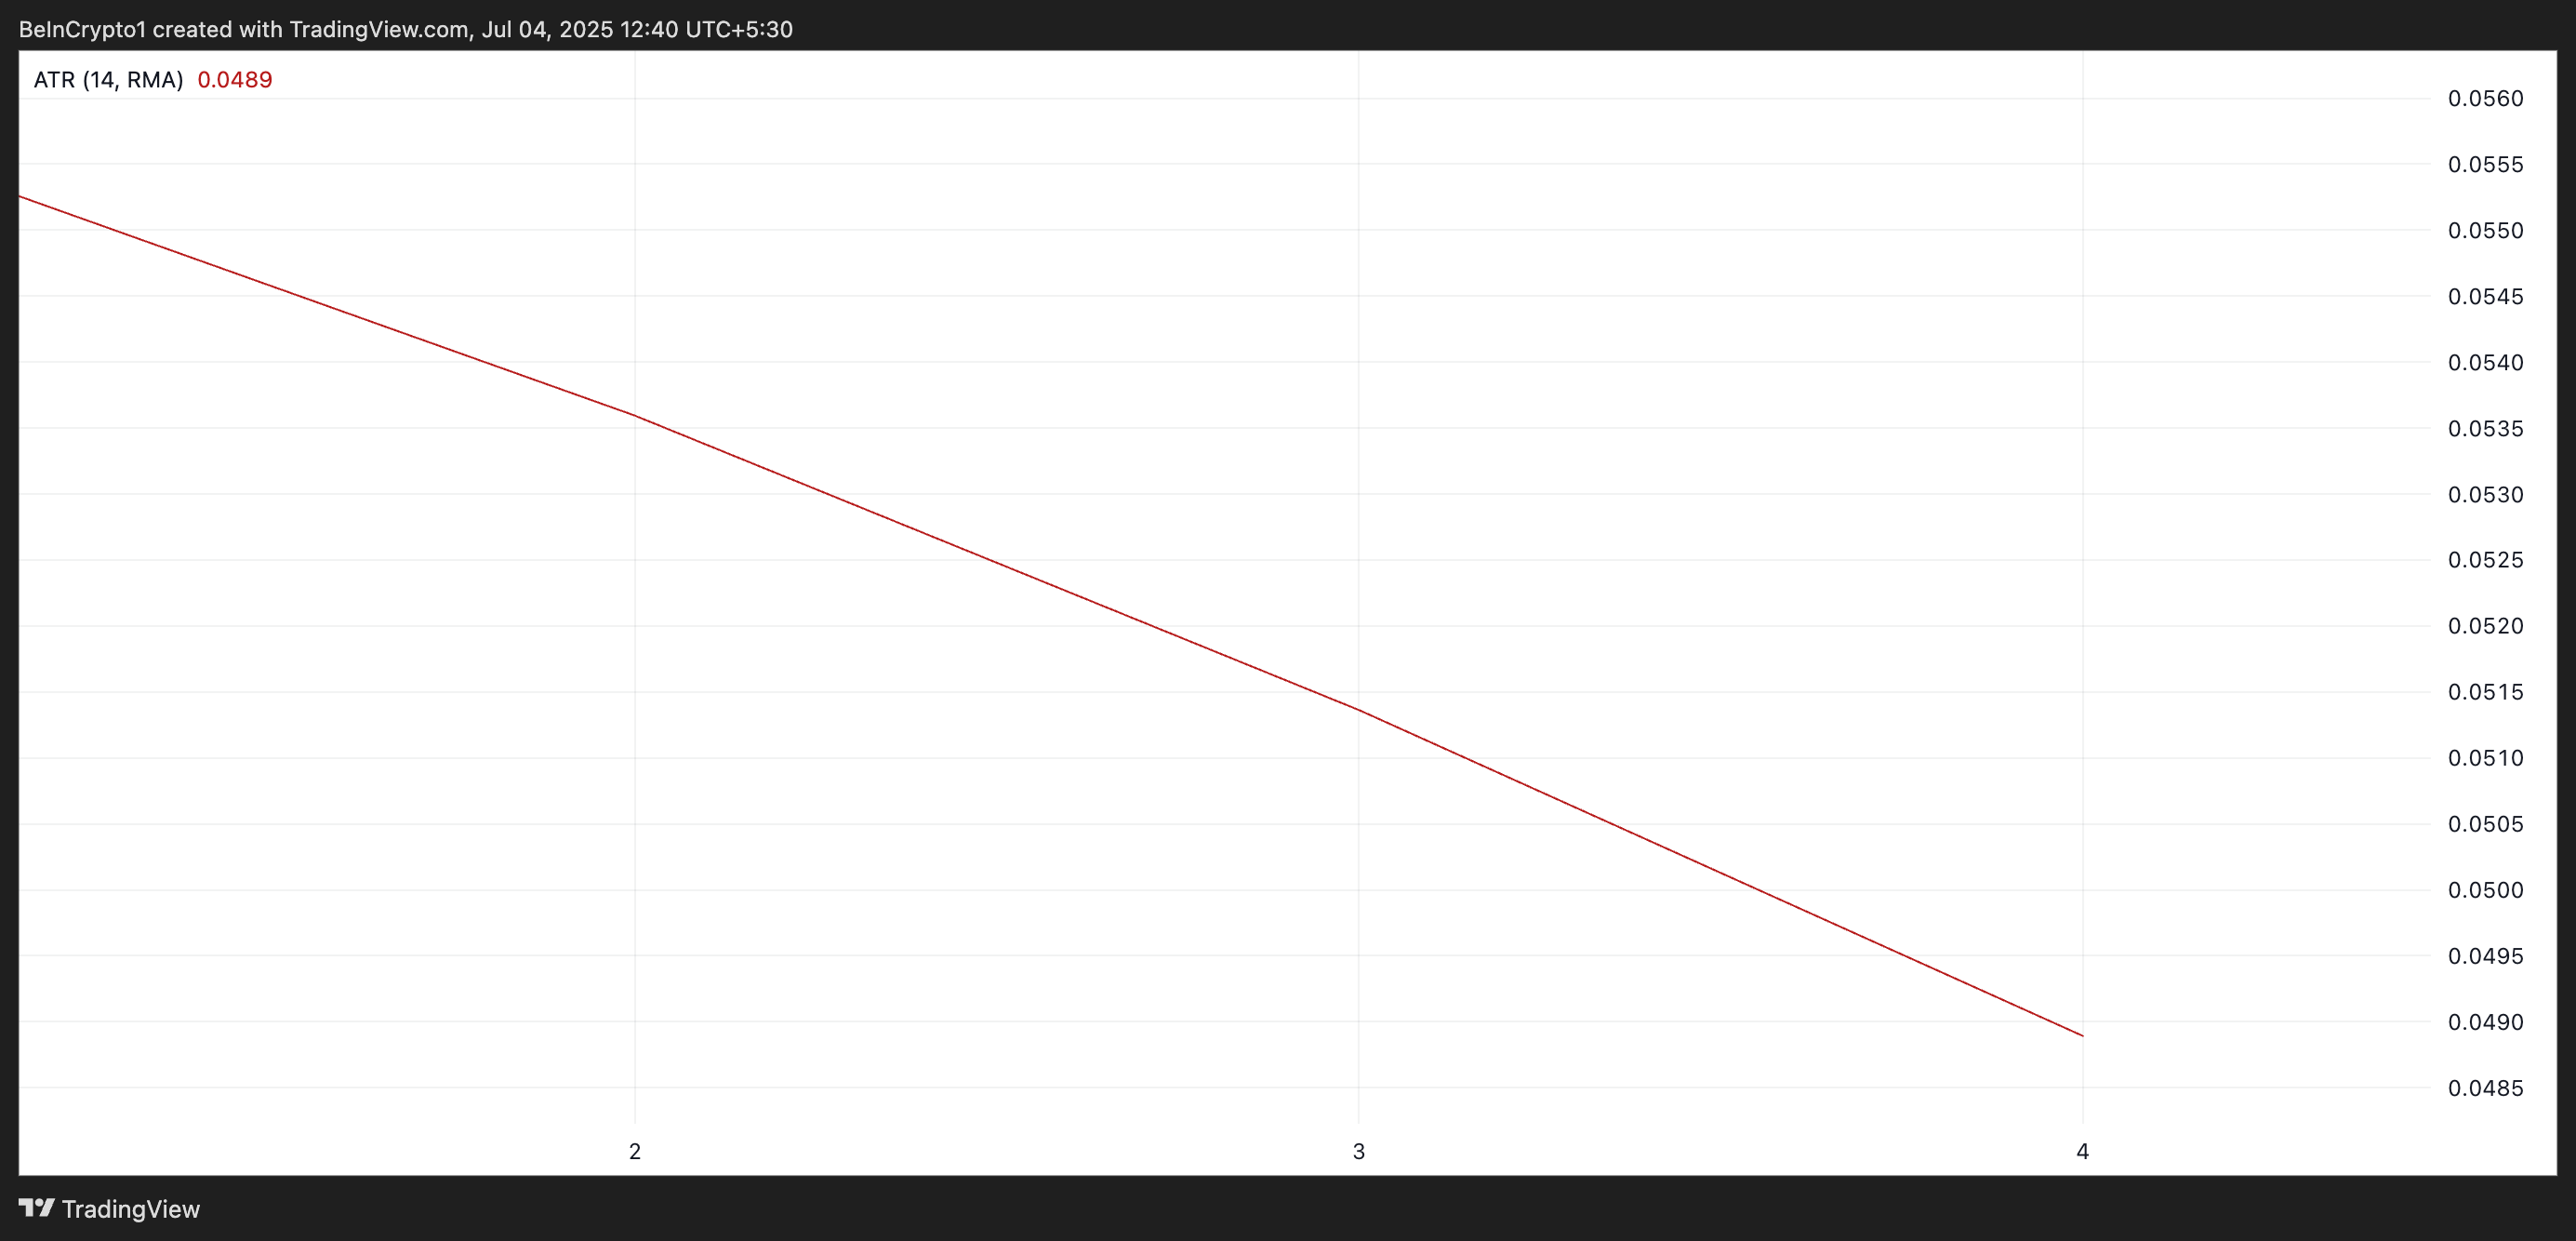
PI ATR. Source: TradingView
The ATR indicator measures the degree of price movement over a given period. When it trends downward like this, it often suggests that price fluctuations are narrowing and momentum is weakening.
These trends indicate shrinking volatility in the PI markets and a lack of strong directional momentum.
PI at Make-or-Break Moment
Periods of low volatility often give way to sharp breakouts or breakdowns once momentum returns. If bearish sentiment resurfaces and the $0.47 support level fails, PI could slide to its all-time low of $0.40.
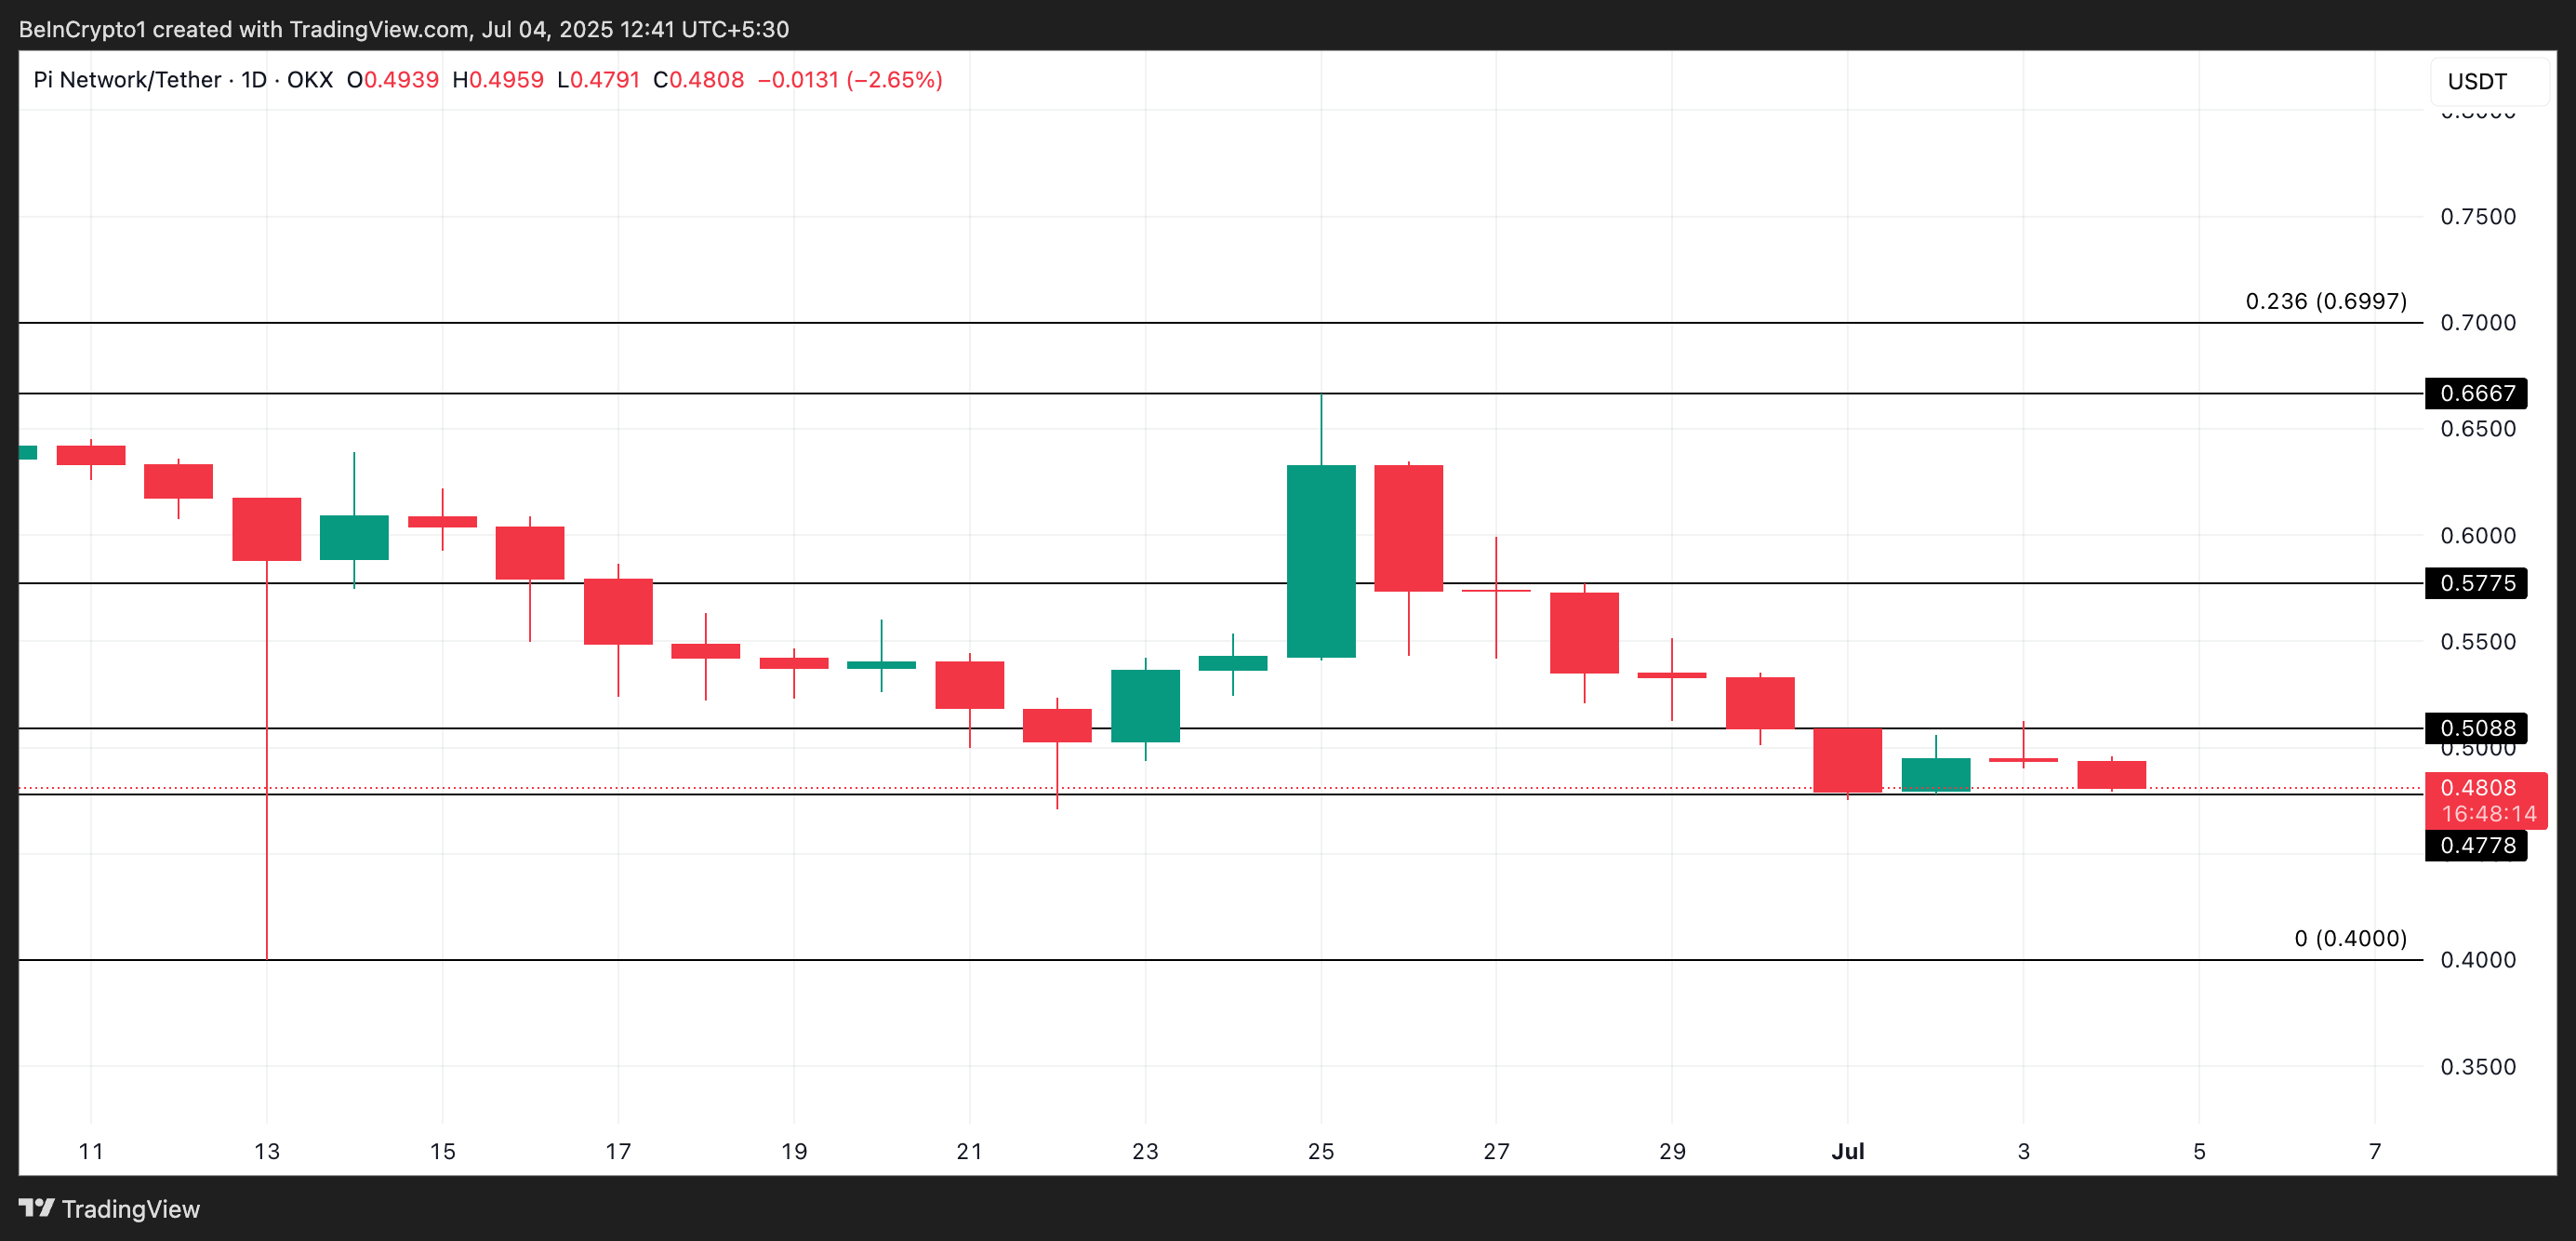
On the other hand, renewed bullish pressure could trigger a breakout above $0.50, with potential upside toward the $0.57 price zone.

Log in to Reply
Log in to comment your thoughtsComments
Related Articles
|Square
Get the BTCC app to start your crypto journey
Get started today Scan to join our 100M+ users