Bitcoin’s Supply Shifts to Weaker Hands—Brace for a Fire Sale or a Hidden Opportunity?

Bitcoin’s latest supply crunch has traders on edge—are weak hands about to trigger a cascade of panic selling, or is this just another shakeout before the next rally?
When retail investors pile in, smart money often piles out. Sound familiar? Here’s why this time might—or might not—be different.
Supply shock or paper hands? The market’s about to vote.
BTC Under Pressure as Weak Hands Accumulate
According to Glassnode, the total supply of coins held by BTC STHs plunged to a year-to-date low of 2.24 million coins on June 22 and has since rebounded strongly. At 2.31 million, these newer or more reactive investors, typically called “weak hands” or “paper hands,” have bought 70,000 coins.
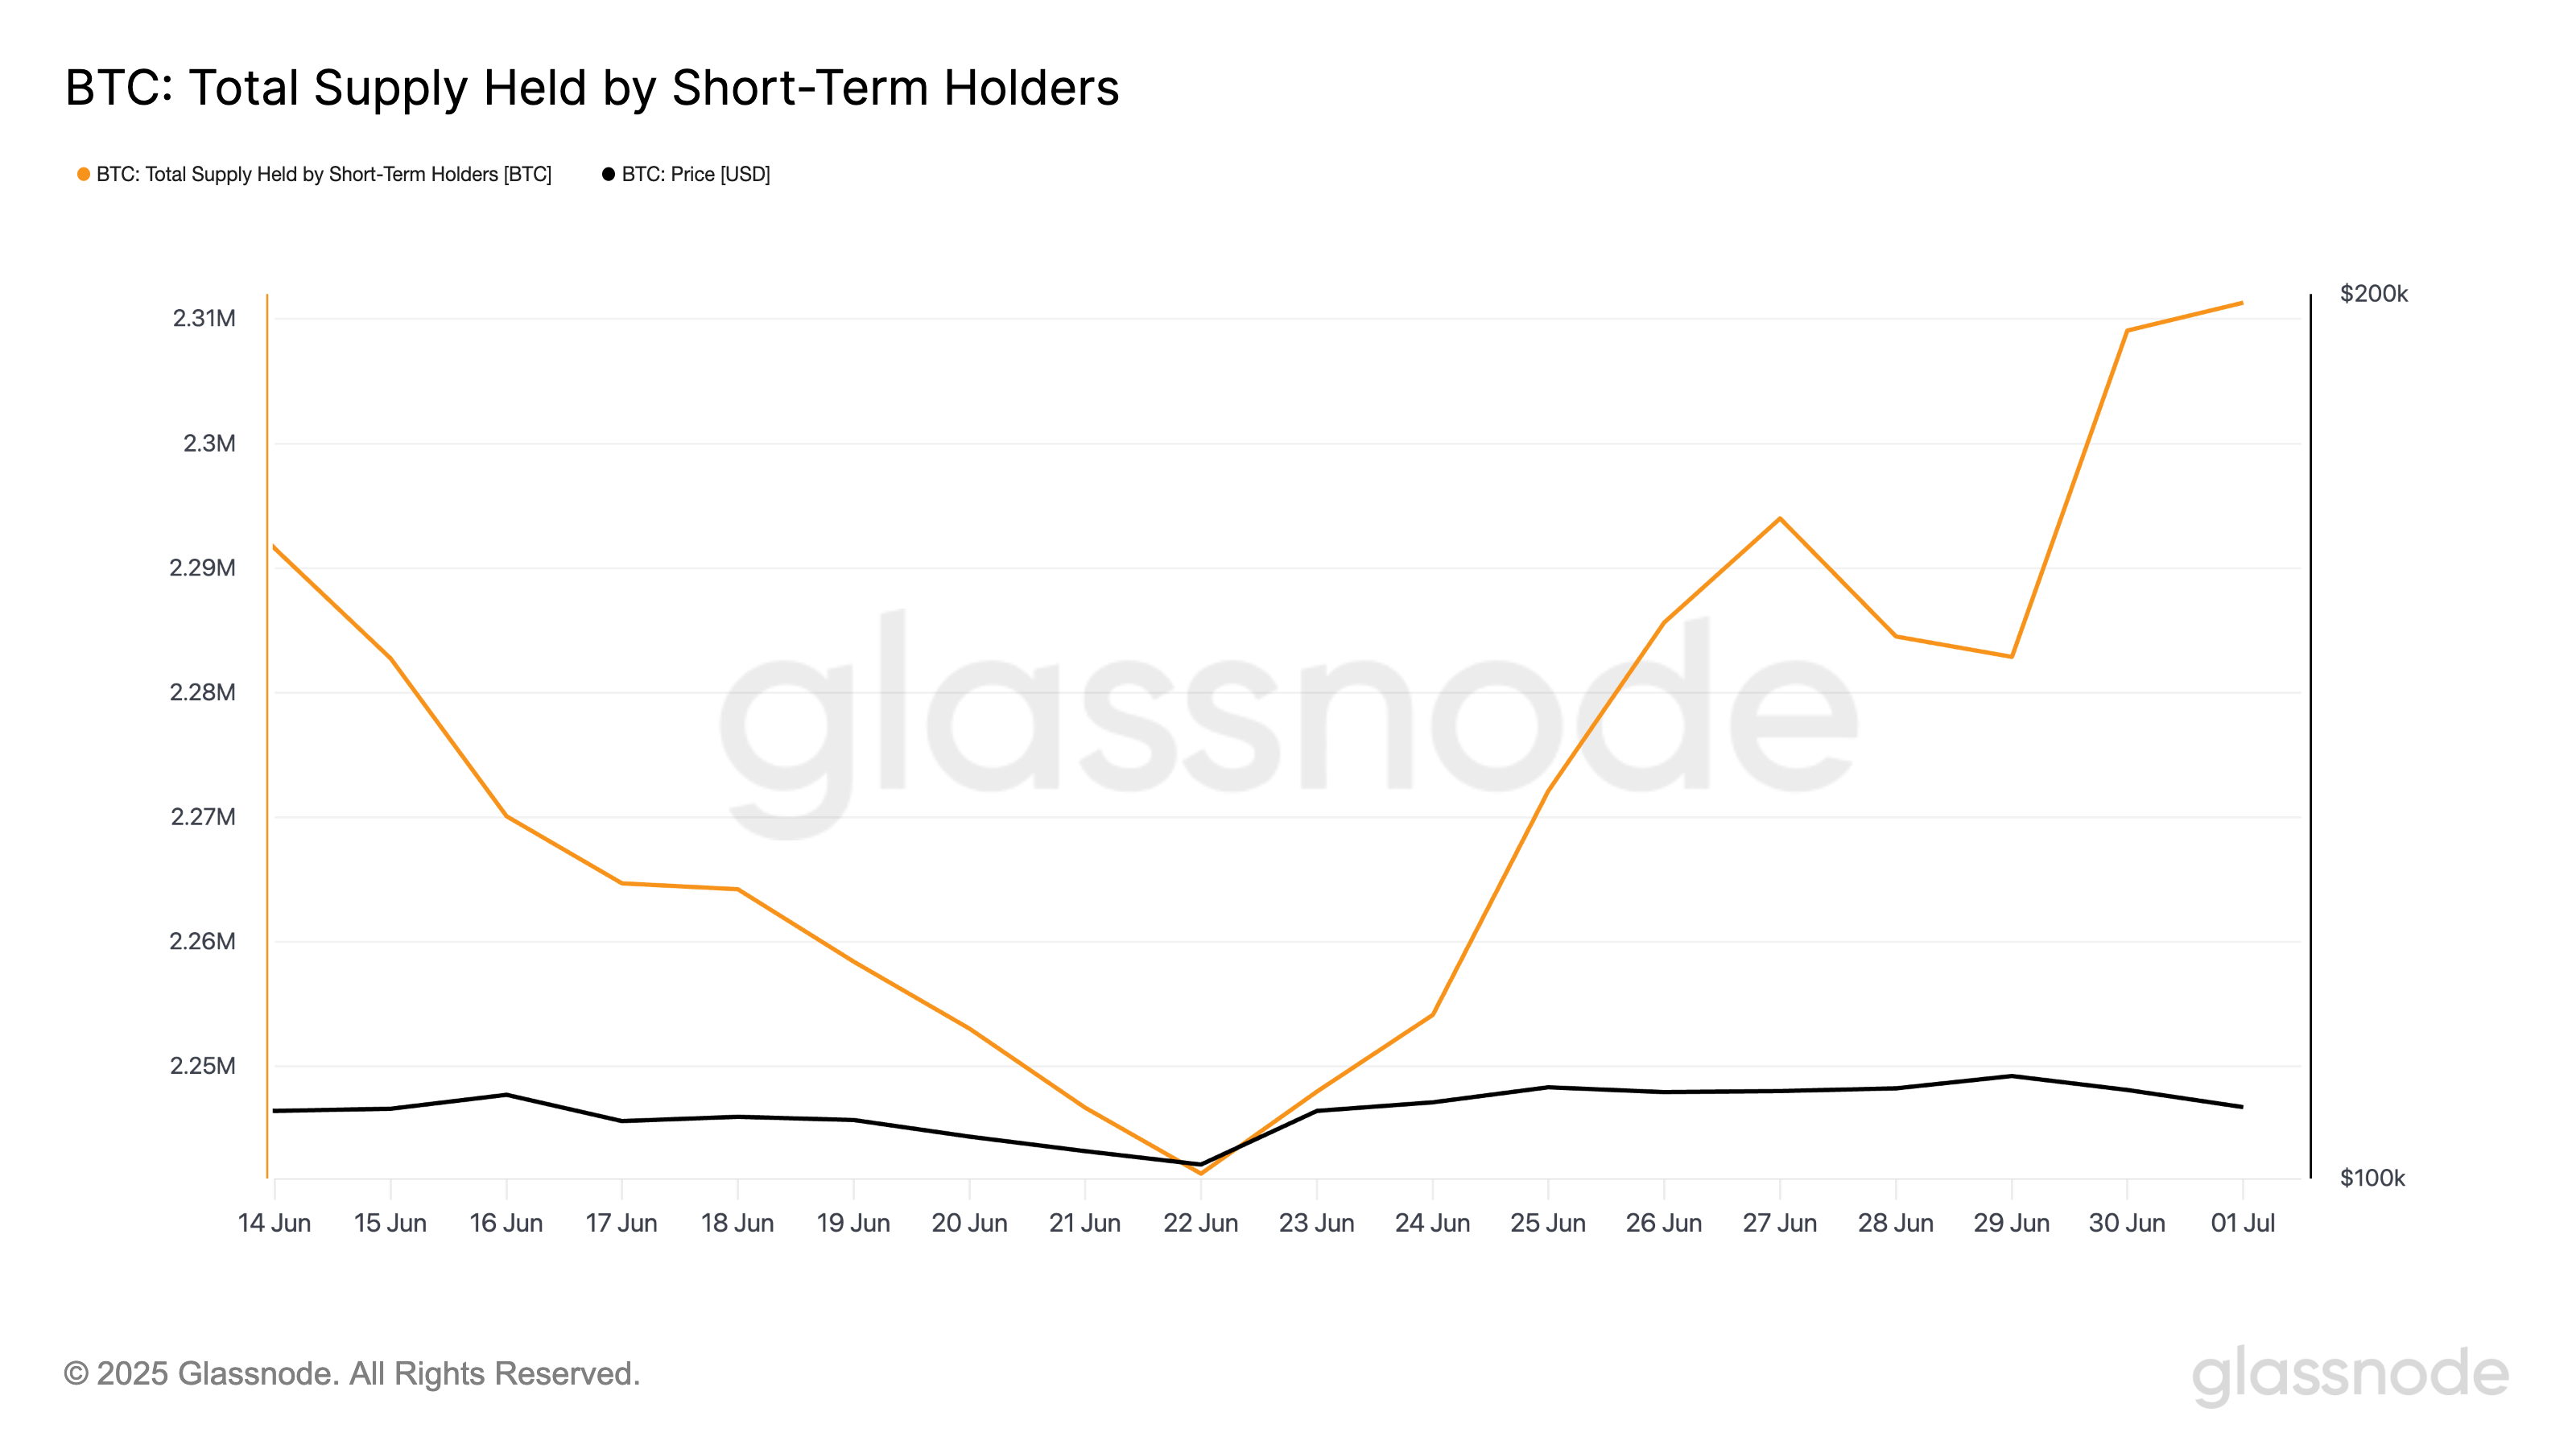
STHs are investors who have held their coins for less than 155 days. The group is historically known for being more sensitive to price fluctuations. Therefore, when their accumulation spikes, an asset is at risk because they will likely exit the market quickly at the first sign of uncertainty, amplifying volatility.
Additionally, data from Glassnode confirms that this trend occurs alongside a slight reduction in holdings by Long-Term Holders (LTHs). According to the data provider, their total supply holdings have dipped by 0.13%.
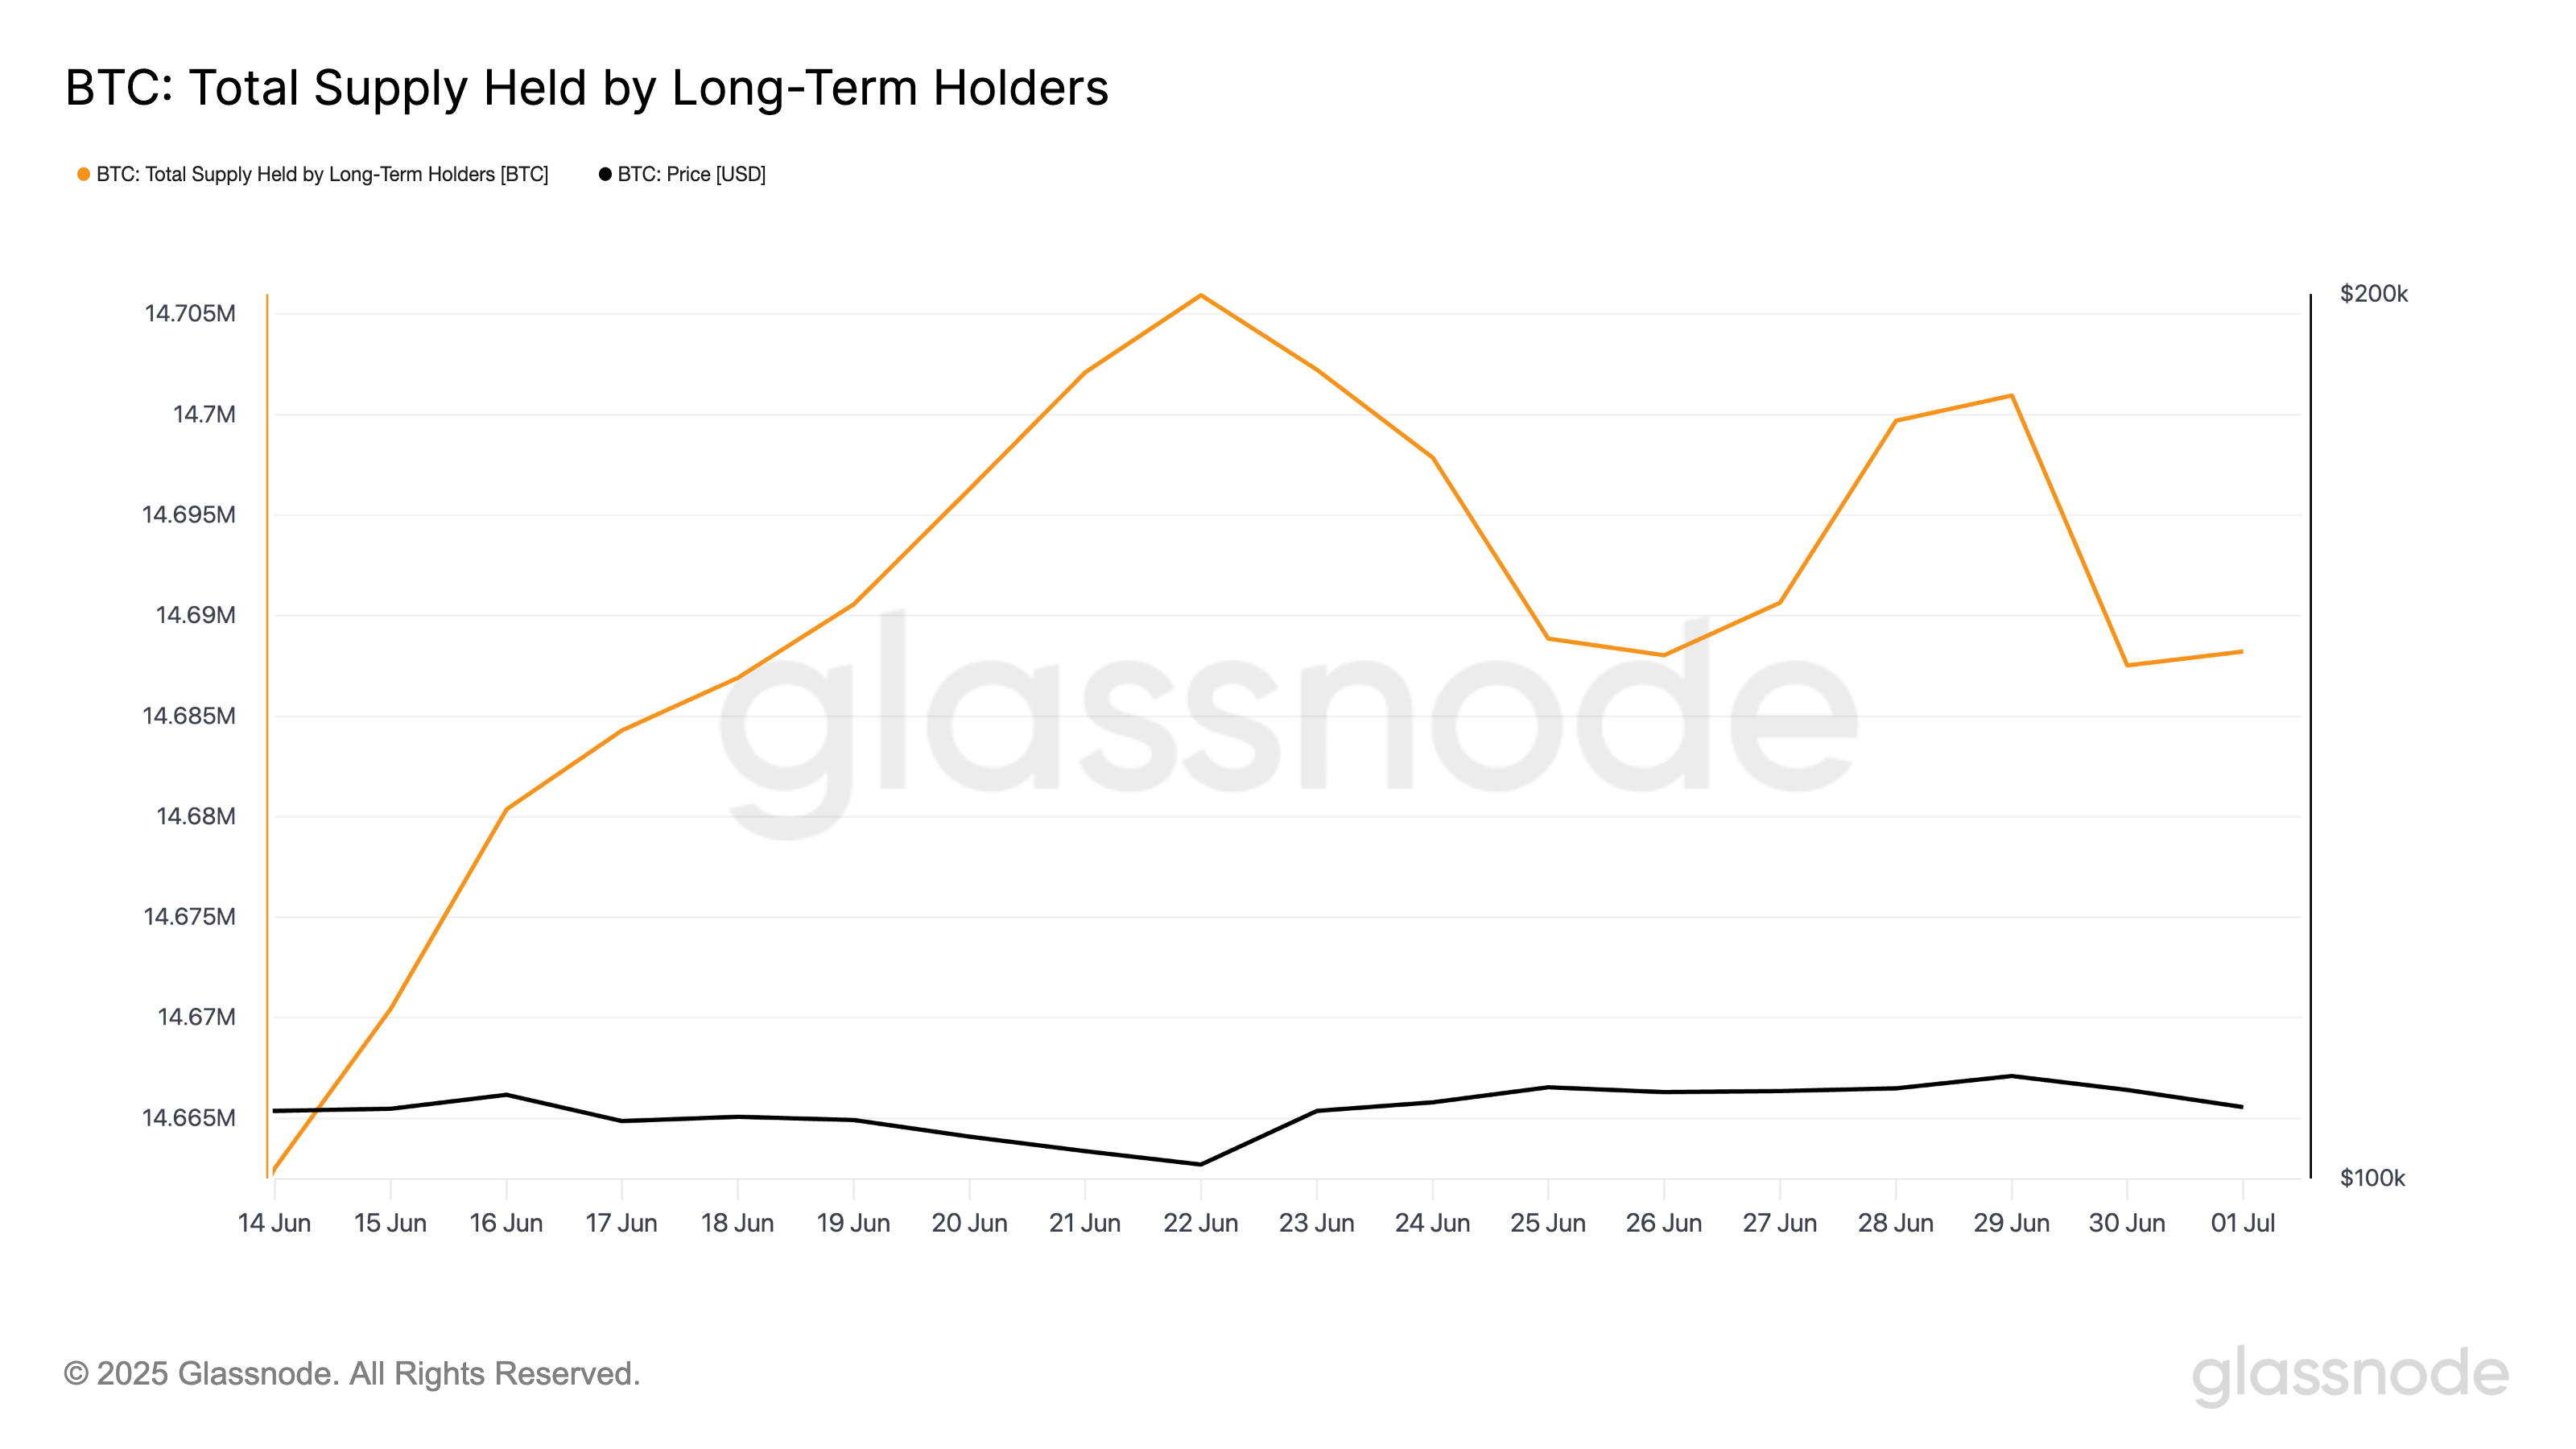
As these investors offload some of their coins, the market’s underlying support may weaken. This makes BTC more susceptible to sharp price swings in the NEAR term.
BTC Struggles Under Bearish Weight
The lengthening red bars of BTC’s BBTrend reflect the steady buildup in bearish pressure. This consistent growth signals that sellers are gradually regaining market control, with downward momentum intensifying.
The BBTrend measures the strength and direction of a trend based on the expansion and contraction of Bollinger Bands. When it returns red bars, the asset’s price consistently closes near the lower Bollinger Band, reflecting sustained selling pressure and hinting at the potential for further downside.
If this continues, the coin could extend its decline and plummet to $104,709.
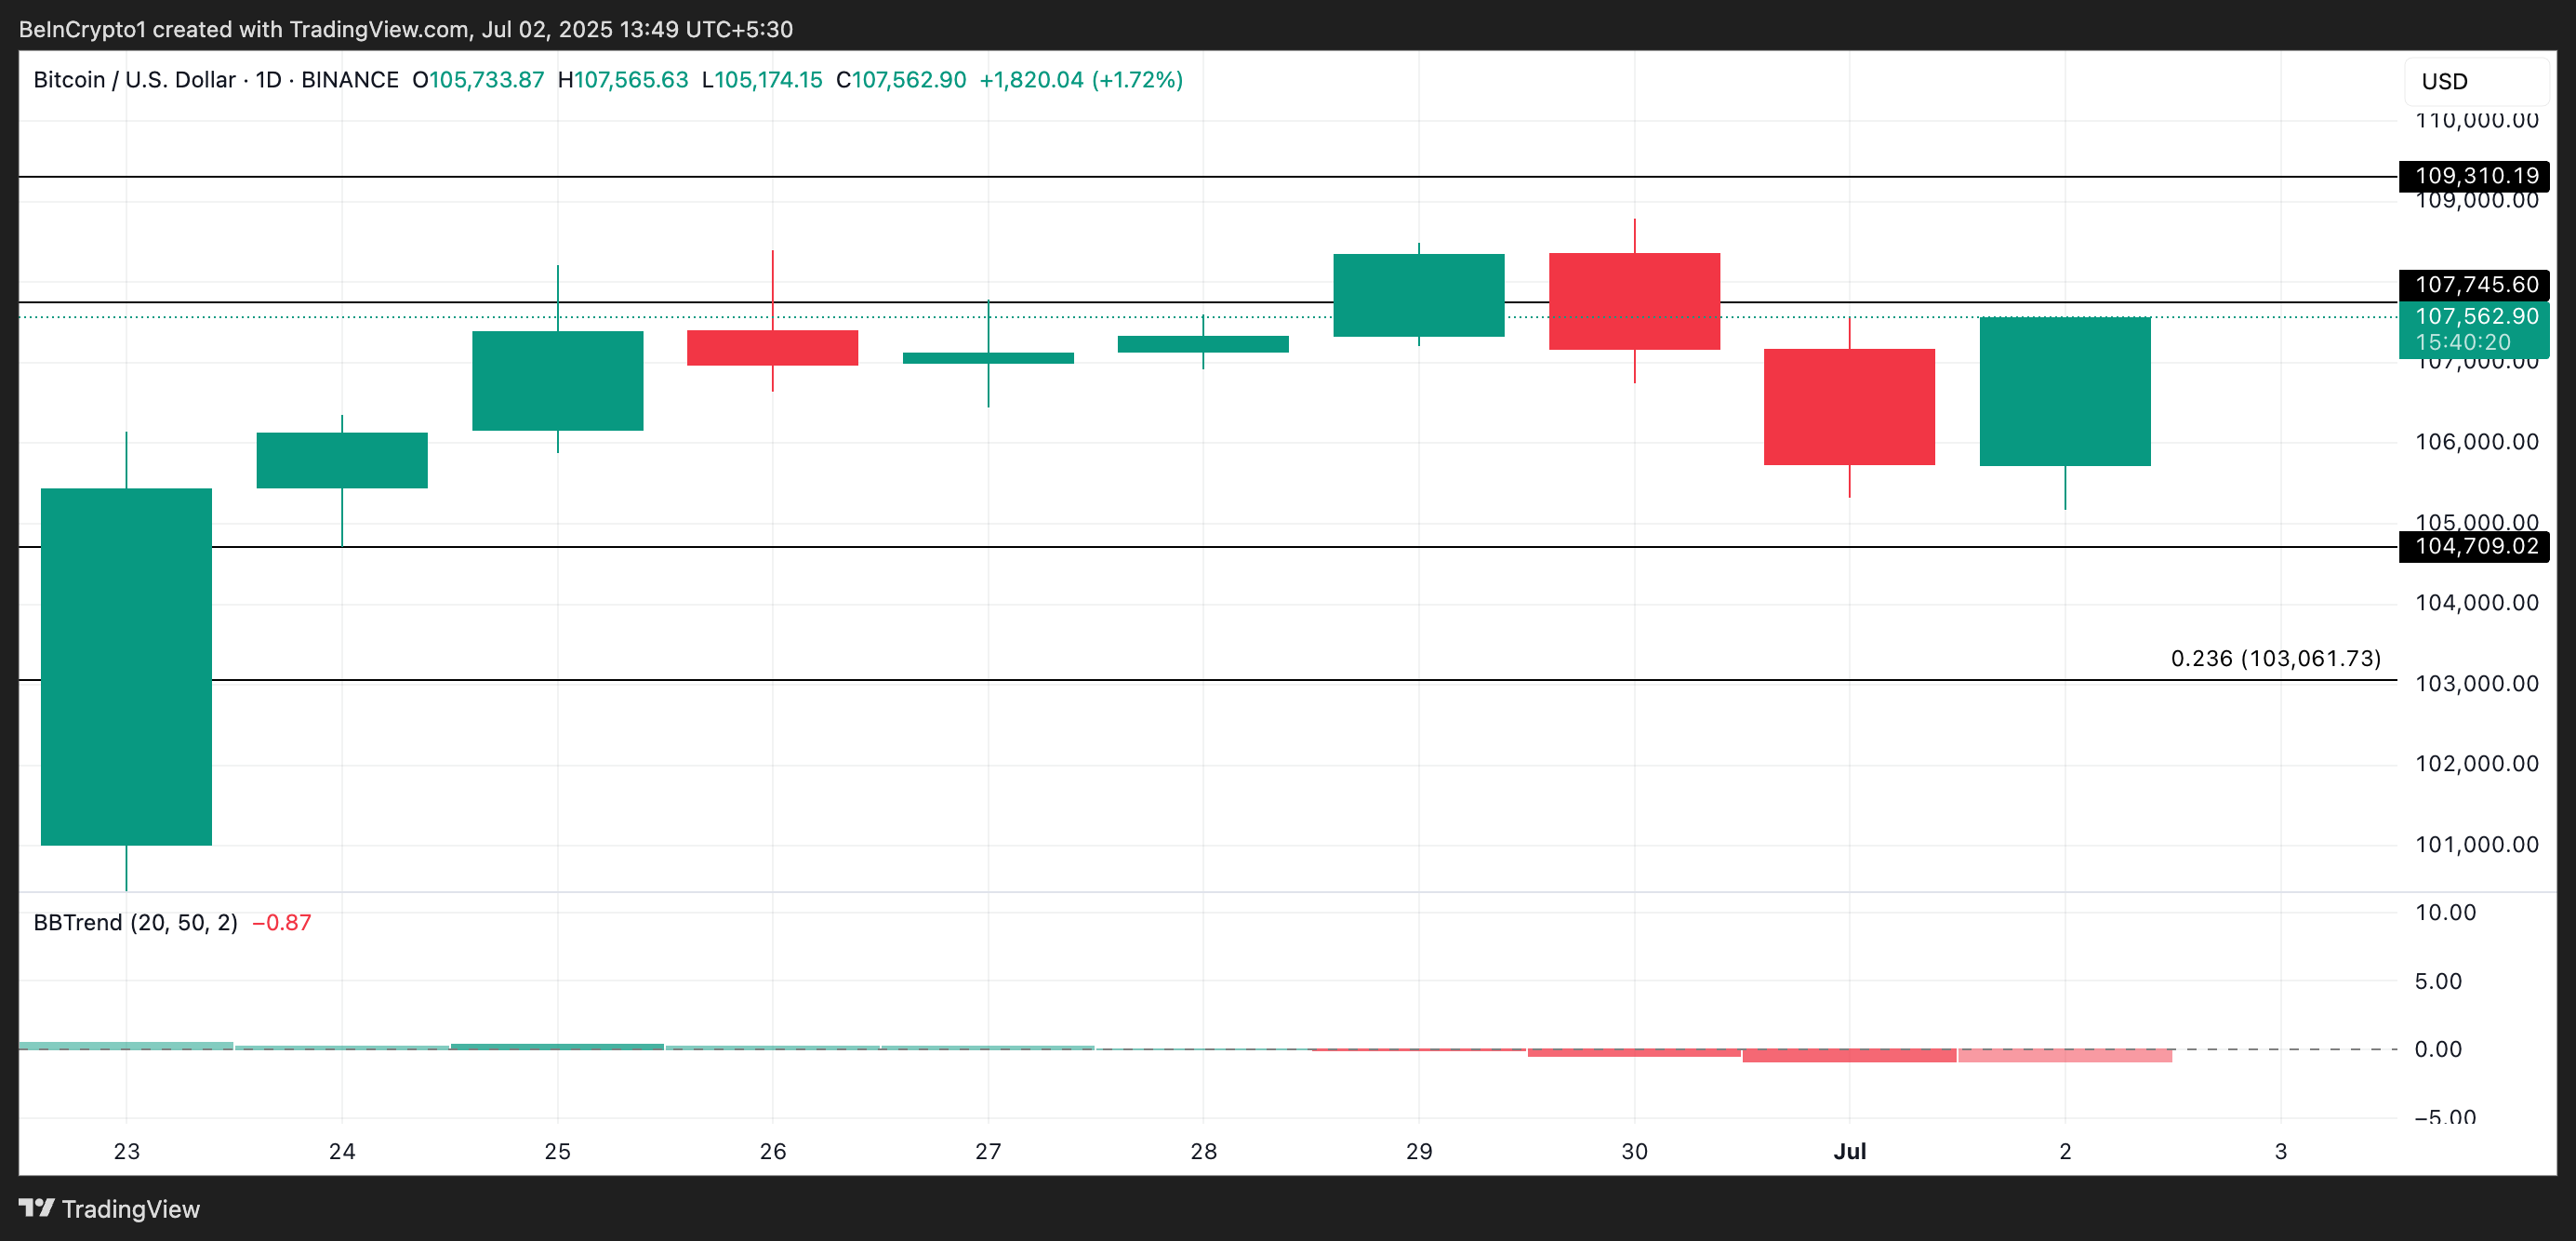
On the other hand, if demand spikes, it could push BTC’s price above $107,745 and toward $109,310.

Log in to Reply
Log in to comment your thoughtsComments
Related Articles
|Square
Get the BTCC app to start your crypto journey
Get started today Scan to join our 100M+ users