Trade the Rising Wedge to Your Advantage
Wedge chart pattern is one of the most used, and popular trading pattern to make potential profit. Wedges formed by two sloping trend lines that converge to each other.
The rising wedge is also known as the ascending wedge, which can be found in a downward trend, and signal a bearish price movement. The two lines that join together are the support line and resistance line.
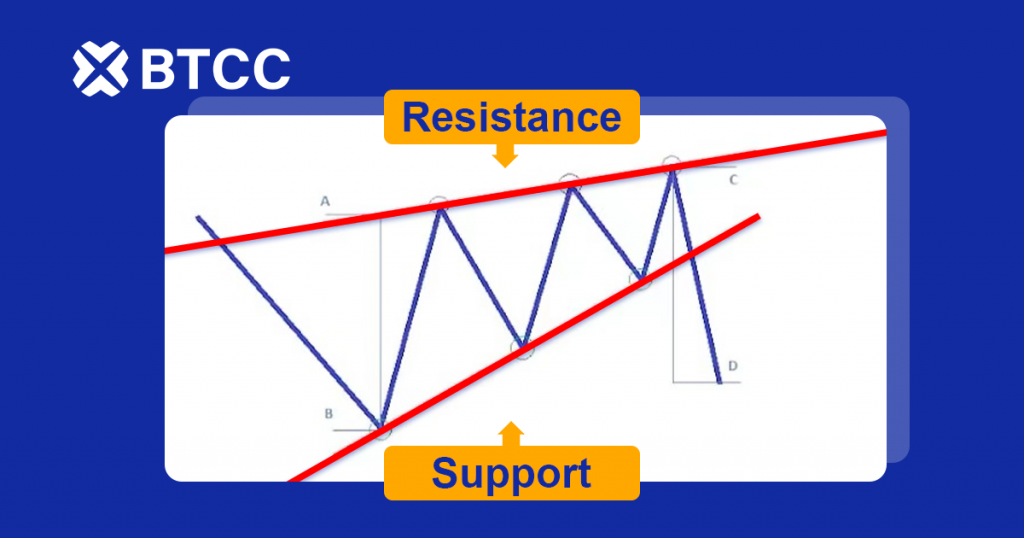
As shown above, the slope of the support line in the rising wedge pattern is steeper that that of the resistance line. Bearish reversal usually come following the rising wedges.
Bearish Reversal Signal
It is very important for traders to recognize the chart pattern to be able to make profit. Bearish reversal signal emerged when the pace of the price making high lows is much faster than the pace of making new highs.
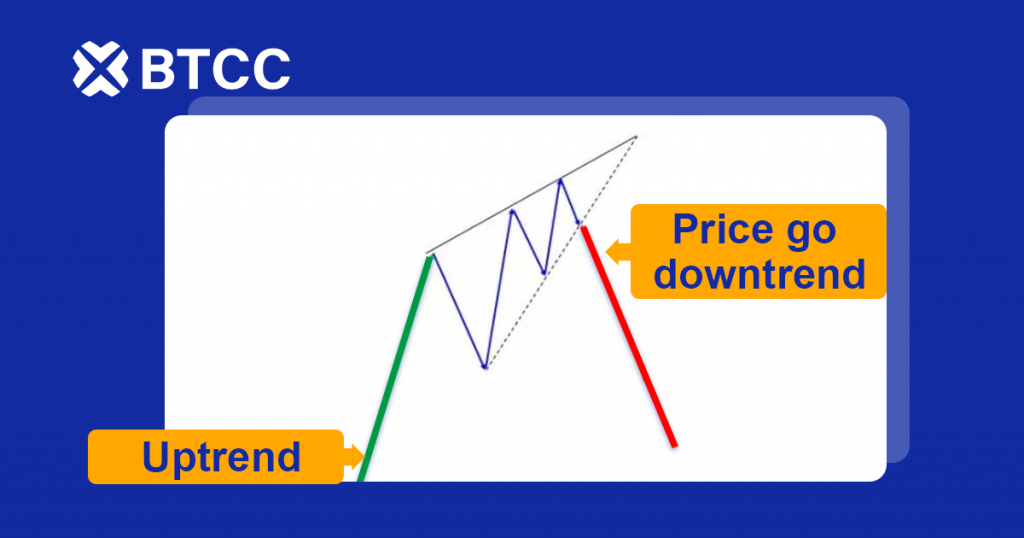
Later, the price is push down toward the downtrend, which suggesting investors are desperate to sell than buy. The downtrend movement suggest a very strong bearish signal.
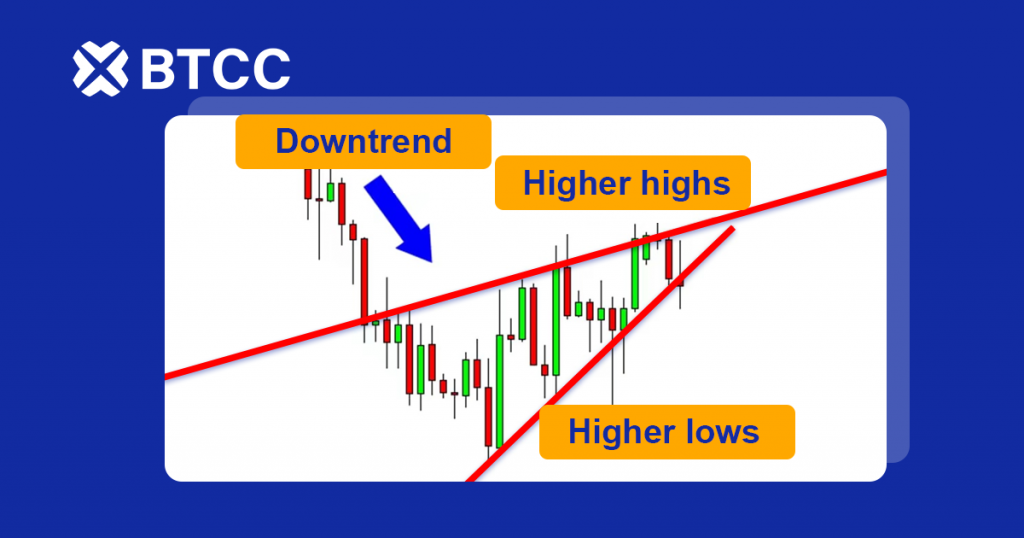
Bearish Continuation Signal
The difference between this type of signal to the one above is that the price came from the downtrend. Similar to the previous example, the rising wedge later fall toward the downtrend.
Trade Rising Wedge with a Stop Loss
Rising wedge pattern can be served as a good indicator for predicting the price movement. Because the pattern tend to move to a narrower price channel, traders can set the stop loss at the start of the trade, as the distance between the opening price and stop loss price will become smaller.
BTCC offer 9 major cryptocurrencies, and offering 16 trading pairs with maximum of 150x leverage.
Download our app now: https://bit.ly/3fMMvQU
Follow us on social media!