BTC Price Prediction 2021: We Hold A bullish Bias Towards Bitcoin Going Forward
The Bitcoin BTC has proved to be a store of value in the face of uncertainties associated with the Coronavirus pandemic and Bitcoin reward halving this year.
We’ve seen massive volatile swings in Bitcoin BTC price this year, which is expected considering that other market sectors also took the hit, plus this has always been the case for Bitcoin since the creation of the number one crypto asset.
Although there were deep bearish swings from the daily time frame up to the monthly, the flagship crypto-asset withered them all and continues to dominate the sector.
This post will look into a general overview of the Bitcoin price, following the monthly chart of the BraveNewCoin Liquid Index (BLX) for Bitcoin. We’ll also do a recap of significant market structures and fundamental drivers.
Below are the headlines for our analysis:
Bitcoin BTC Fundamental Drivers
- Bitcoin BTC Miners Revenue
- Bitcoin Network Difficulty
Bitcoin BTC Multiple Time Frame Analysis and Projections
- An Overview of BraveNewCoin Liquid Index for Bitcoin
- Bitcoin BTCUSD Daily TF Analysis and Projection
- Bitcoin BTCUSD Weekly TF Analysis and Projection
- Bitcoin BTCUSD Monthly TF Analysis and Projection
Bitcoin BTC Fundamental Drivers:
Miners’ Reward
Over the year, the BTC miners’ reward has been known to correlate with the Bitcoin price. An increase in miners’ reward means miners have more incentives to hold on to their Bitcoin. On the other hand, a decrease shows a lack of confidence and a BTC sell-off to cover their running costs.
Unlike other Bitcoin halving years where the Bitcoin price slumped along with the halving, this year, the BTC price stayed calm in the face of a crashing reward.
You may be wondering how this is possible. We believe that the expansion of the DeFi Decentralized Finance space with billion dollars’ worth of crypto locked in as collateral kept the bitcoin price-stable since there are new means to cover their expenses.
| You May Like: Invest in bitcoin futures which enable you to speculate on what you think the price of bitcoin will be in the future without actually owning any bitcoin. |
The BTC miners’ reward chart below shows a rejection of bearish accumulation resistance, confirming an increase in revenue that propelled a rise in the BTCUSD exchange rate.
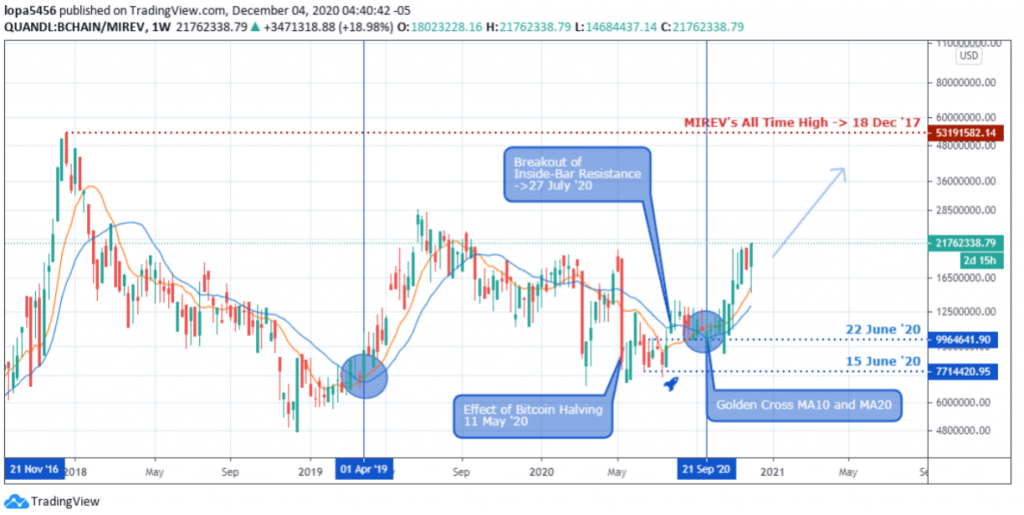
Notice similarity between the 01 April 2019 move where the bottom was confirmed by a golden cross of the MA-10 and MA-20. Also, the sharp slump in miners’ revenue on 11 May 2020 did not affect Bitcoin’s price.
Now that the Bitcoin price is at its all-time high, we expect the Bitcoin price to surge beyond the $20K mark as we go into Q1 2021.
Bitcoin Network Difficulty
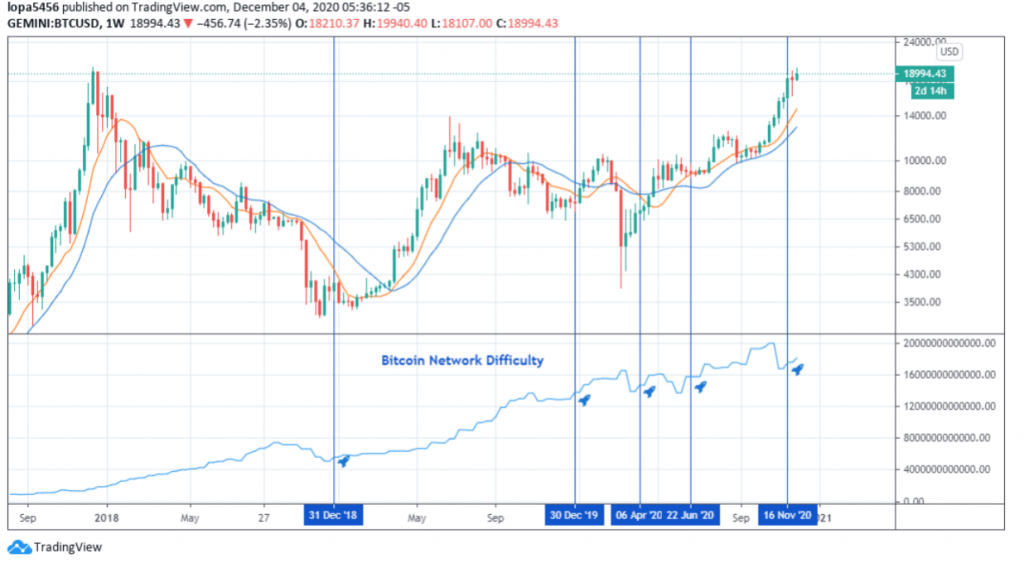
The chart overhead shows the Bitcoin network difficulty. Notice an increase in Bitcoin price following an increase in network difficulty from a slump.
Recently, the increase in network difficulty on 16 November 2020 points towards a higher Bitcoin price in 2021.
Bitcoin BTC Multiple Time Frame Analysis and Projections
An Overview of BraveNewCoin Liquid Index for Bitcoin
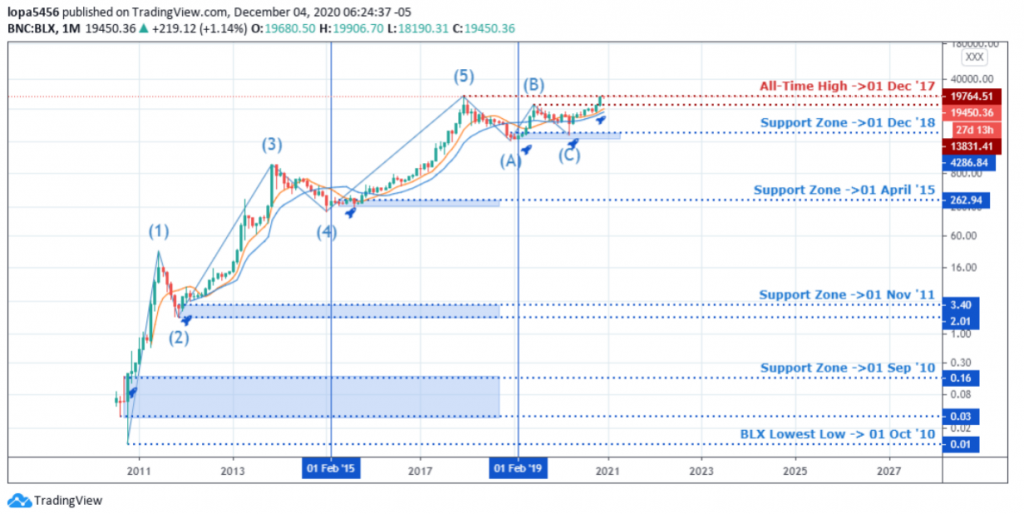
The above monthly chart of the BraveNewCoin Liquid Index for Bitcoin shows a general overview of the BTCUSD, starting from July 2010.
It shows the Bitcoin price completing the fifth impulse Elliot wave in December 2017 and moving into the A-B-C corrective wave completed in March 2020.
So, what does this suggest for the coming price of Bitcoin in 2021? Well, this could mean the beginning of a new bullish impulse wave, which we believe has already started.
However, time-series charts are not linear by nature; thus, we should expect corrective waves as the BTCUSD exchange rate increases.
Let’s jump to the charts, starting from the daily time frame and rounding up monthly.
Bitcoin BTCUSD Daily TF Analysis and Projection
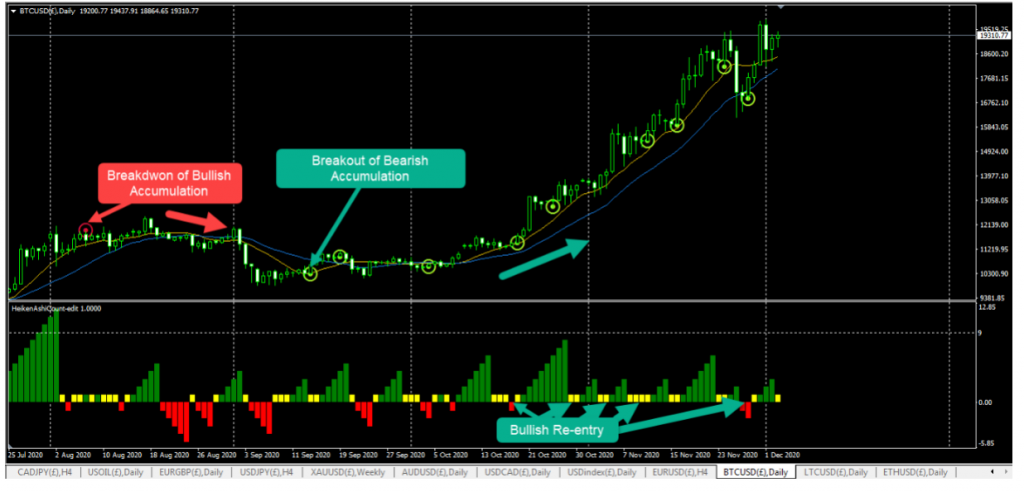
The daily time frame shows the different dates where the Bitcoin price breached bullish and bearish accumulation resistance candlestick patterns.
A breakdown of bullish accumulation support 11560.36 on 07 August 2020 confirmed a slowing of the bullish trend that started on 04 July 2020.
The bulls assumed control of the exchange rate after a price surge above the bearish accumulation resistance on 14 September 2020 and followed by subsequent breakouts on (04, 19, 26 October) and (11, 17, 24, 28 November) respectively.
The Heiken Ashi Count indicator in the sub-window shows re-entry points in yellow, coinciding with bearish accumulation resistance breakout.
Daily Chart projection into 2021
The recent break above bearish accumulation candlestick resistance on Monday, 28 11 2020, was an excellent level to scale into the bullish trend going into 2021. We expect a similar move before we can consider adding to our position.
At the moment, we look to take profits above the 19950 area and wait for bullish signals.
Bitcoin BTCUSD Weekly TF Analysis and Projection

After exiting level-25 of the Relative Strength index on 29 March 2020, the BTCUSD entered an upward trend and while the RSI continues to hover above the level-25.
The above chart shows a golden cross of the 10 and 20 weekly Moving Average. Re-entry levels to scale into the bullish trend is identified by the BTCUSD exchange rate trading between the MA-10 and MA-20.
The Heiken Ashi count indicator in the sub-window also confirms a bullish scale in points, where there are not more than two consecutive red weekly bars.
Weekly Chart projection into 2021
Notice how the Bitcoin price collapse towards the 10 and 20 weekly
Moving Average, after surging more than three consecutive Heiken Ashi bars on 14 06 2020 and 06 09 2020. We anticipate a correction to the ten weekly MA, where we’ll enter long at a more stable price.
Bitcoin BTCUSD Monthly TF Analysis and Projection
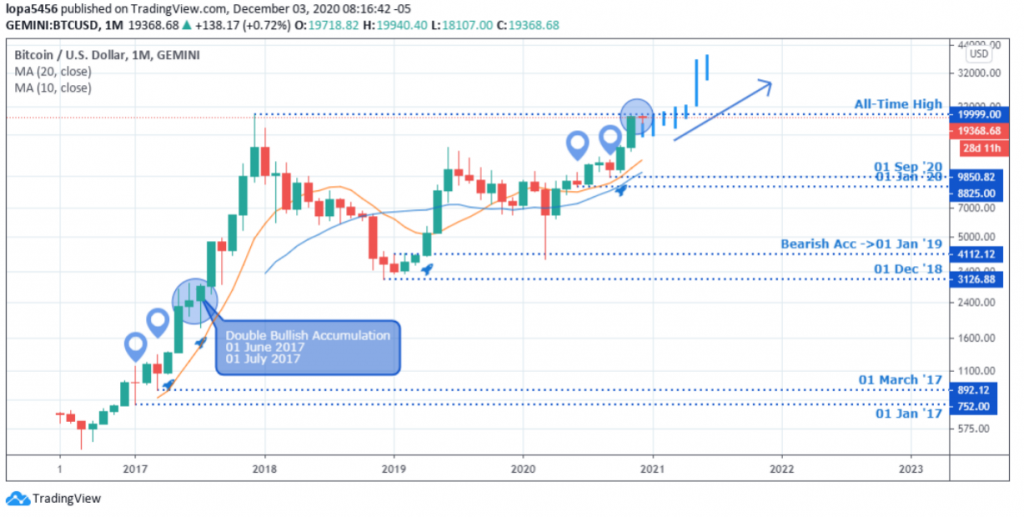
From historical data, Bitcoin price is known to surge after the four-year interval halving of miners’ reward. The monthly chart overhead shows bearish closing candlestick patterns in March 2017, similar to the June and September 2020 bearish closing prices.
The market structure proves the likelihood of the Bitcoin price shooting for the $30K round number resistance in 2021. Before the upward continuation of the bullish trend, we anticipate a correction of the current bullish swing after a breach of the all-time high (approximately $20,000).
Conclusion
Following the analysis above, we hold a bullish bias towards Bitcoin going forward into Q1 2021 as the last quarter of 2020 comes close.
By following proper money management strategies like fixed fractional money management and dollar-cost averaging, you can be sure to attain a sustainable passive income trading Bitcoin BTC into 2021.
| You May Like: Go for a free account on BTCC and trade bitcoin futures which enable you to speculate on what you think the price of bitcoin will be in the future without actually owning any bitcoin. |