A Shorter Time Frame Chart May Tell You Bitcoin is Just About to Soar
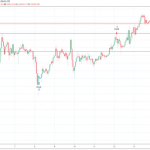
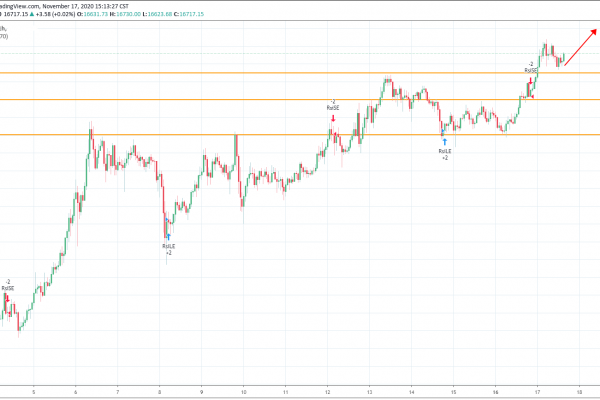
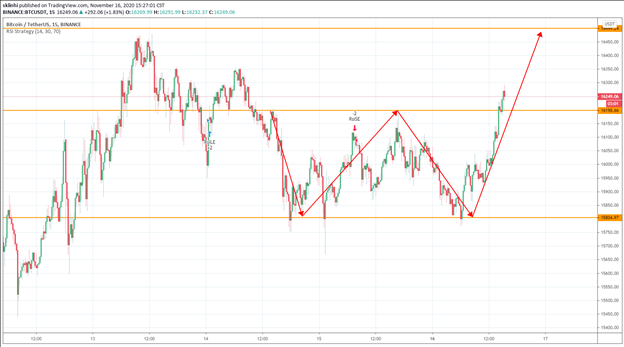
Bitcoin has been waiting to outbreak $16,500, the crucial resistance level since the pullback from the year high at $16,493 three days ago. As many of the traders may expect a greater correction to occur since there is an 18% soared in Bitcoin’s price from the point when Bitcoin breakthrough $14,000. However, a clear W pattern can be found in the 15min chart, showing that there is a strong support zone between $15,800-$16,000 for Bitcoin. Therefore, Bitcoin is still on its bull run and expected to soar shortly.
Download our app now: https://bit.ly/32corRW
Disclaimer: Our content is intended to be used and must be used for informational purposes only. It is very important to do your own analysis before making any investment based on your own personal circumstances. You should take independent financial advice from a professional in connection with, or independently research and verify, any information that you find on our Website and wish to rely upon, whether for the purpose of making an investment decision or otherwise.
Follow us on social media!